This Stock Is a Coiled Spring Ready to Launch
I scrolled through some charts this morning, and Target (TGT) jumped out at me.
I don’t really care about Target’s quarterly comparable sales results or whatever retail analysts are hand-wringing about this week.
I’m not here to debate whether the new CEO’s $2 billion turnaround plan will work.
That’s just not how I roll. I look at the chart first, and it tells me this thing wants to go higher.
The Technical Setup That Got My Attention
TGT is in a daily squeeze right now. Think of it like a coiled spring – that’s what happens when volatility gets compressed, and the stock is building pressure for its next big move.
The Bollinger Bands are contracting inside the Keltner Channels, and when that setup releases, you usually get explosive price action in one direction.
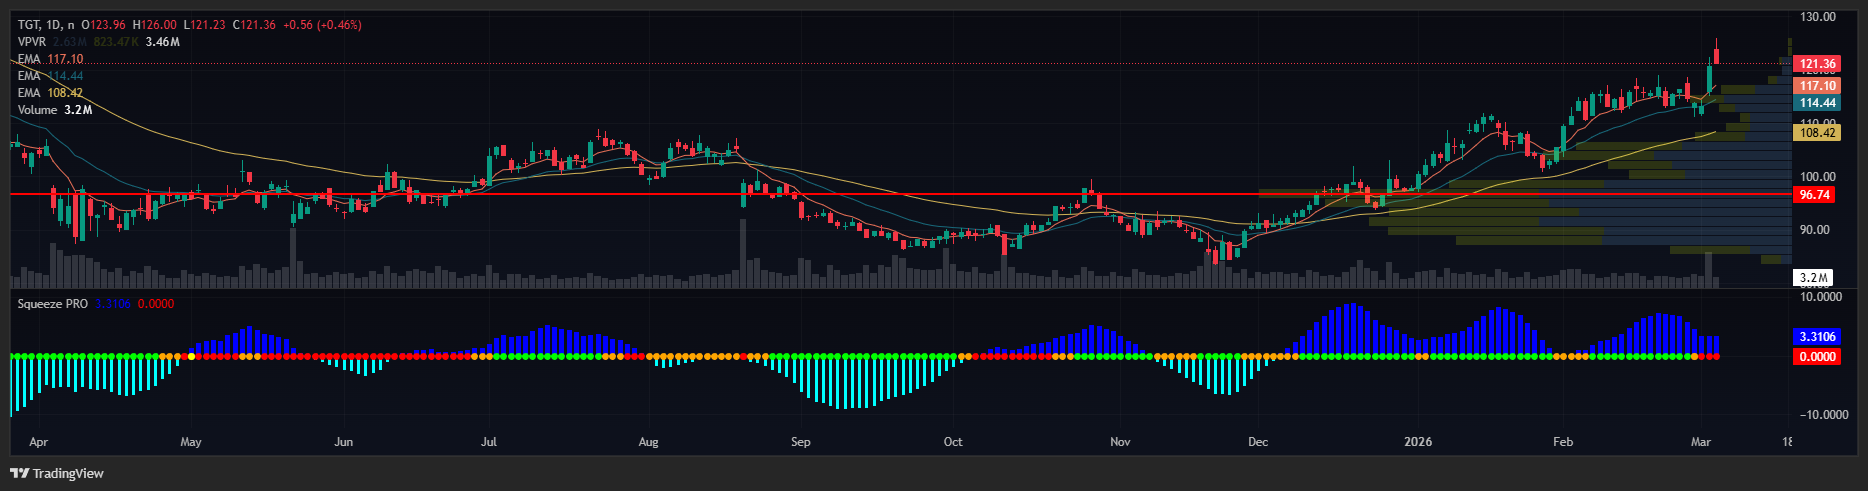
The EMAs are beautifully stacked, too. The 9-, 21-, and 50-day exponential moving averages are lined up like dominoes, with the shorter ones sitting above the longer ones.
That’s your trend confirmation right there – when you get pullbacks in a setup like this, they usually bounce right off those moving averages like a trampoline.
Why Earnings Winners Keep Winning
Here’s the thing about momentum – it feeds on itself. TGT already proved it’s an earnings winner, pumping 7% after beating estimates with $2.44 EPS versus the $2.15 analysts expected.
When a stock shows it can surprise to the upside, the smart money starts paying attention. Fund managers who missed the initial pop start looking for their entry on any dips. That puts a floor under the stock and creates more buying when it tries to break higher.
The fundamentals are actually turning too – first positive sales growth guidance in years, new management talking about inflection points.
Again… I don’t trade on that stuff, but when the technical setup aligns with improving fundamentals?
That’s when you get the really explosive moves.
The Recovery Story Everyone’s Missing
Look at the chart again: TGT crashed all the way down to $83.44 and has already clawed back to $122. But here’s what’s wild – this stock was trading at $261 back in 2021.
We’re talking about a stock that’s still 53% below its previous highs with a daily squeeze ready to fire and stacked EMAs pointing higher.
If this thing can break above recent resistance and hold, there’s room to run back toward those 2021 highs.
What I’m Watching
I’m not chasing the stock at current levels. Any pullback to those stacked EMAs around $114-118 gets my attention.
If TGT can hold above $120 and that daily squeeze starts firing green, I’m looking at $140 as the first target, maybe $160 if the momentum really builds.
The key is waiting for confirmation. Earnings winner + technical breakout + fundamental inflection story = the kind of setup that can run a lot further than people expect.
This is exactly the type of setup I live for. The chart says go, fundamentals are turning, and there’s still massive room to run.
I’ll be watching those levels closely… and so should you.
More from Wake-up Watchlist


Everyone Is Watching the Wrong AI Stock
Jun 18, 2026


3 Swing Trades I’m Watching This Week
Jun 16, 2026