A Quiet Setup Just Started Loading in One of the Strongest Charts I Am Watching
While the market was posting its longest Nasdaq winning streak since 2009, TJX was coiling.
The S&P gained 4.5% last week, crossed 7,000 for the first time, and recovered from a correction to an all-time high in just 11 days, the fastest move of that size in 98 years, according to Bespoke.
Most of the attention went to the names that led that run.
TJX was not one of them. It sat quietly in a rising channel, compressing above its moving averages, loading up.
This morning, futures are modestly lower, peace talks faded over the weekend, and Iran tensions are back. Honestly, after a run like that, a pullback was probably coming regardless.
I am not reading this as a crisis. I am reading it as a market that needed to breathe.
In that kind of tape, I go back to the same thing I always go back to. I blew up two accounts early in my career because I chased noise without a process.
What I built after those failures was TPS: Trend, Pattern, Squeeze, in that order every time. TJX is what it finds right now.
All three boxes are present.
The Trend
The trend is the direction of price over the larger timeframe. A trend is up when the price makes higher highs and higher lows, and the moving averages stack in the right order.
An EMA, or Exponential Moving Average, is a line that tracks the average price with more weight on recent data. A faster EMA above a slower EMA means momentum is moving higher.
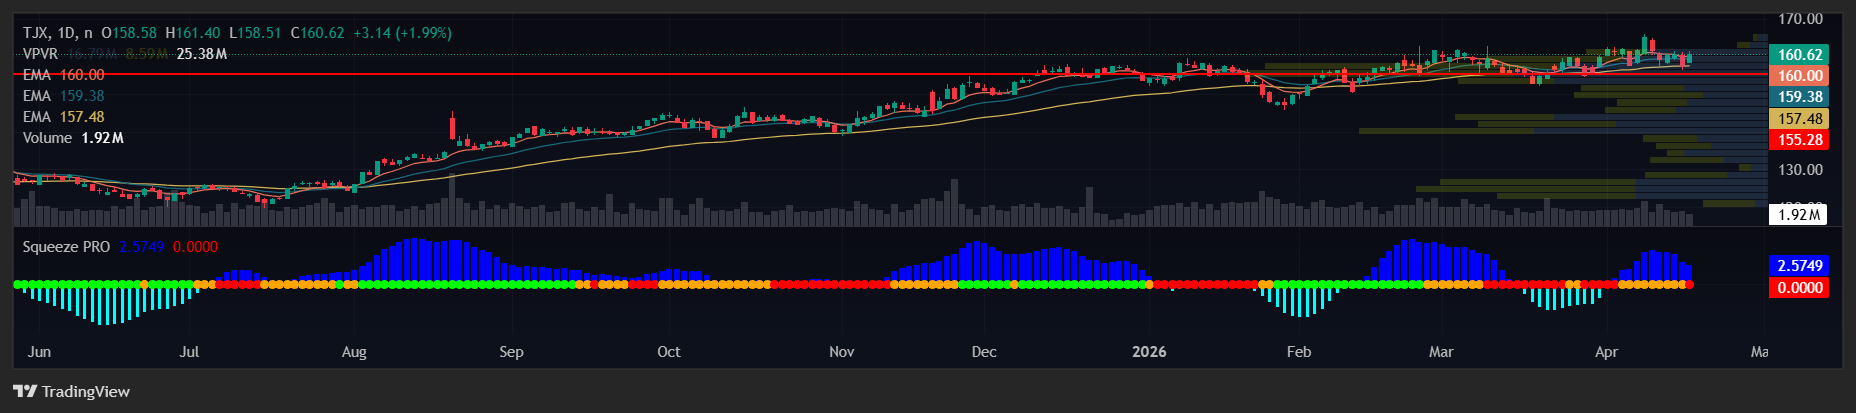
TJX is trading at $160.90, sitting above its 8-day EMA at $160.21 and 20-day EMA at $159.59 on the daily chart. Both are pointing higher and stacked correctly on the weekly chart as well.
The 200-day SMA, the long-term baseline, sits at $146.54, well below the current price.
The trend is intact across multiple timeframes. That is the first box.
The Pattern
The pattern is what price is doing within the trend. After running to $165 in February, TJX pulled back into its rising channel and has been compressing just above the 8- and 20-EMA levels. Each pullback finds support at a higher level than the last, with RSI at 53 and room to run.
That is the structure I want to see before a squeeze fires. The second box checks.
The Squeeze
The squeeze occurs when volatility contracts before a move. Think of it like a coil tightening. Price stops making big swings and starts moving in a narrower range, loading up for the next leg.
The daily squeeze is setting up on TJX right now. The coil is loaded. The third box checks.
The Business Case
TJX runs TJ Maxx, Marshalls, and HomeGoods. In a high-tariff, uncertain macro environment, off-price retail is exactly where consumers go when wallets tighten. When other retailers get stuck with excess inventory because tariff costs disrupted their supply chains, TJX buys that inventory cheaply and passes the value to customers.
The macro that is hurting most of retail is a direct tailwind for TJX’s business model.
The numbers confirm it.
Revenue of $60.37 billion, ROE of 59%, and EPS growing at nearly 18% annually over the last three years. The company returned $4.3 billion to shareholders last fiscal year through buybacks and dividends.
The stock is up 103% over the last three years and 137% over five.
This is not a speculative name riding a theme. It is a compounding business that is also technically being set up.
Next earnings are May 20, before the open. That gives this setup roughly a month to develop and fire before event risk hits. I want to be in and out before the number drops.
Your Action Plan
This is a watchlist idea, not a trade alert.
TJX moves more slowly than the setups I prefer in Daily Profits Live, where I go after stocks that can move fast in 24 hours or less.
But the TPS is clean, the business earns it, and the chart is coiled in a market where nobody is paying attention to it.
If you want to learn more about TPS and how I use it to find quick gains, click here.
More from Wake-up Watchlist


Everyone Is Watching the Wrong AI Stock
Jun 18, 2026


3 Swing Trades I’m Watching This Week
Jun 16, 2026