5 Trading Secrets To Win Every Day In The Markets
Welcome to Trade of the Day!
Congratulations on taking the first step to opening yourself up to a new world of daily wealth creation.
In that sense, you’ve made a smart decision.
We at Monument Traders Alliance are committed to changing the way you approach speculation. You see, like most investors, you’ve probably safely tucked away 90% to 95% of your money – earning a modest return that’s hopefully outperforming the S&P 500 while also outpacing inflation. That’s smart, that’s safe, that’s secure – but it’s also boring.
With Trade of the Day, we’ll help you put the remaining 5% to 10% of your wealth to work by speculating intelligently.
By giving you the proper tools and market intelligence, we can help send your daily profit-making potential into the stratosphere.
Let’s be crystal clear – this isn’t reckless trading. Far from it. Rather, every week you’ll use calculated, precise strategies that have proven to be successful – and enormously profitable – for decades.
Of course, not every speculation will pan out. However, the ones that do pan out will give you a toe-curling rush of adrenaline, unlike anything you’ve ever experienced before. It’s this exhilaration that makes life worth living, and you’ll be in a position to feel it every week as a Trade of the Day subscriber.
Welcome to the Alliance…
Meet the Professionals
Bryan Bottarelli
Head Trade Tactician
Whether it was selling the Star Wars figures he collected as a little boy for 50 times their value – or using $125 of grass-cutting money to buy a Michael Jordan rookie card that he later sold for $1,500, it was clear Bryan Bottarelli was a born trader – possessing the unique ability to identify opportunities and leverage those investments.
Graduating with a business degree from the highly-rated Indiana University Kelley School of Business, Bryan got his first job out of college trading stock options on the floor of the Chicago Board Options Exchange (CBOE).
There he was mentored by some of the country’s top floor traders in the heart of the technology boom from 1999 to 2000 – trading in the crowded and lively Apple computer pit. Executing his trades in real time, Bryan learned to identify and implement some of his most powerful trading secrets… secrets that rarely make their way outside the CBOE to individual traders.
Recognizing the true value of these methods, Bryan tapped into his entrepreneurial spirit to take a risk. He walked off the CBOE floor and launched his own independent trading advisory service called Bottarelli Research. From February 2006 to December 2018, Bryan gave his precise trading instructions to a small, elite group of high-level traders – most who joined him on day one have been clients ever since.
As a so-called “play tactician,” Bryan uses his hands-on knowledge of floor trading to create elegant, powerful, and profitable recommendations. And by using the same hedging techniques taught by professional floor traders, Bryan is able to deliver his clients remarkable gains while strictly limiting their total risk.
Along the way, Bryan has developed a cumulative track record that could impress even the most successful hedge fund manager. Today, Bryan spends his days giving his proprietary, precise and profitable trading signals to an elite group of traders inside The War Room, one of the most elite trading forums ever created.
Karim Rahemtulla
Head Fundamental Tactician

Karim began his trading career early… very early.
While attending boarding school in England, he recognized the value of the homemade snacks his Mom sent to him every semester – and sold them for a profit to his fellow classmates who were trying to avoid the horrendous British food.
He then graduated to stocks and options, becoming one of the youngest CFOs of a brokerage and trading firm that cleared through Bear Stearns in the late 1980s. There he learned his trading skills from veterans of the business. They had already made their mistakes, and he recognized the value of the strategies they were using late in their careers.
Educated in England, Canada, and the United States, Karim’s fluent in several languages. He completed his undergraduate studies in economics and foreign languages. He also earned a master’s degree in finance.
Karim travels the world regularly, seeking out the best investment opportunities. He’s also the author of the bestselling book Where in the World Should I Invest?
He developed a covered call strategy in the late ’90s while investment director of The Oxford Club and identified a unique aberration. The trading system he built allowed him to hand his readers a win percentage of more than 80%.
Not satisfied with that system, he turned to Long-Term Equity Anticipation Securities (LEAPS) and put selling strategies as co-founder and chief options strategist for the groundbreaking publication Wall Street Daily.
After that, he honed his strategies for readers of Automatic Trading Millionaire, where he didn’t record a single realized loss over a span of more than 40 recommendations in an 18-month period.
While even he admits the record is not the norm, it showcases the effectiveness of a sound trading strategy. He has closed out positions in as little as a few hours for triple- and quadruple-digit gains. His focus is on “smart” trading. Using volatility and proprietary probability modeling as his guideposts, he makes investments where risk and reward are defined ahead of time.
Today, Karim is all about lowering risk while enhancing returns using strategies such as LEAPS, spreads, put selling, and, of course, small-cap investing. His background as the head of a venture capital publication gives him unique insight and experience that he now offers to an elite group of War Room traders on a daily basis.
Now that you’ve met the trading pros, let’s get into the five secrets…
Trading Secret No. 1: Use a 3-Minute Chart
The first secret will set the tone for the other four. It deals with how to properly track stock moves on a day-to-day basis.
You see, most traders will give you a chart analysis based on a daily chart – or a weekly chart – or sometimes even a yearly chart.
But when you think about it, that’s the wrong approach. After all, daily, weekly and yearly charts are all using old data. They’re backward-looking. All of those moves are known to the world – and they’ve already occurred. They’re over and done with.
Attempting to profit off a chart formation that’s already happened is like trying to cash in a daily lottery ticket using yesterday’s winning Powerball numbers.
That’s why your first secret is to trade by tracking the minute-by-minute movements of a stock using a 3-minute chart.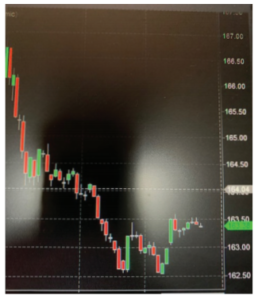
If you switch your charting software to a minute time frame, you’ll see a new price bar form every 180 seconds – which gives you a live, real-time look at the stock price movements within that time Any number of transactions could appear during this period, and they’re all encapsulated into this one powerful price tick.
Below is a screenshot of a 3-minute price chart on Dollar General (NYSE: DG).
Can you see the double bottom that formed right above the $162.50 level? Pretty clear, right?
However, if you’re not tracking a 3-minute chart – or if you’re looking at a daily Dollar General chart – there’s no way you would know that this level has offered double-bottom support. This is just one small example of how beneficial the 3-minute chart can be for you.
Knowing how to use a 3-minute price chart to identify winning trade formations in real-time will change the way you trade forever. Let’s explore how you can combine this with secrets No. 2 and No. 3.
Trading Secret No. 2: Track a “W” Pattern
Okay, now that you’re using a 3-minute chart, let’s reveal exactly what you should look for.
To begin, the stock market is a constant war between bulls and bears. Watching the 3-minute price chart shows you the battlegrounds that determine who wins each directional fight.
As you’ll soon see with your own eyes, minute-by-minute trading is always a series of tests and price probes to ultimately determine a dominant direction.
One way to properly “decode” this ongoing tug of war is by looking for “W” and “M” patterns using a 3-minute price chart.
Watching these two patterns play out will reveal to you whether the bulls or the bears have temporarily won (or lost) the directional battle. Whenever one of these patterns completes itself (which means that the losing side has retreated), this tells you that the winning side is now free and clear to move the stock in their direction.
Whenever this “free and clear” pattern occurs, you can typically join the winning side for a quick and easy intraday winner.
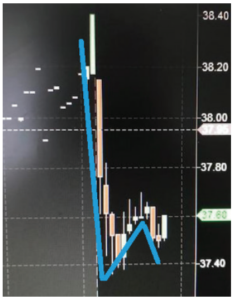
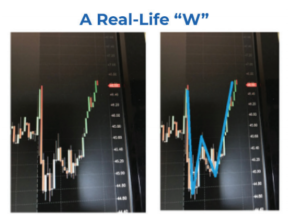
Let’s walk you through one real-time example step by step using the “W” formation… Here’s a 3-minute price chart of Toll Brothers (NYSE: TOL).
As you can see, Toll Brothers gapped up to $38.40 – which is where the bears sold it – causing it to retrace back down
to $37.40. This is where the bulls bought in – causing a mini jump to $37.60. At this point, the tug of war has begun! And in the process, you can see the “W” pattern starting to take shape – noted in blue.
At this point, we’d be carefully watching the action in The War Room.
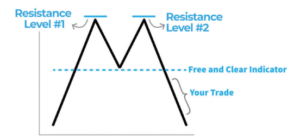
Why? Because a move above the $37.70 level (which is the middle point of the “W”) could be an indication that the bulls have temporarily exhausted the bears – and the remainder of the “W” pattern would be free and clear to play out.
Here’s what happened next…
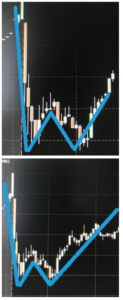
As you can see, Toll Brothers did indeed move above the $37.70 level – thus indicating that the bulls regained control from the bears – and the “W” pattern is now free and clear to play itself out.
This is when you would get an alert to buy Toll Brothers calls in our trading recommendation room.
And here’s how the formation was completed…
With the bears temporarily on the sidelines, the bulls were able to push Toll Brothers all the way back above $38, which resulted in a quick and easy intraday winner.
So when you see a “W” pattern, you’d play an upside call. Properly identifying this pattern in real-time – and playing it when there’s a “free and clear” moment – can open your eyes to daily trading opportunities that you’ve never been exposed to before.
These are the sorts of patterns you’ll receive as a member of Monument Traders Alliance.
And guess what?
These patterns are happening every single hour – of every single trading day! A clean version of the “W” formation looks like this: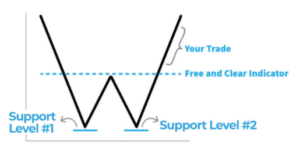
And in real life – using a 3-minute chart – it looks like this…
Trading Secret No. 3: Track an “M” Pattern
Okay, so a “W” pattern is what you play when stocks are moving up. But what happens if stocks are moving lower?
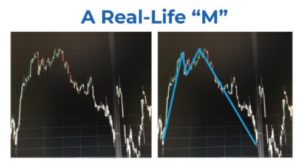
Well, that’s where secret No. 3 comes into play… It’s called the “M” pattern, the polar opposite of the “W” pattern you just learned about above. You trade it using the exact same process as described in the “W” above – only this time, the bears win and an “M” pattern forms.
The “M” pattern looks like this…
As you can see, the “M” occurs when the bears win the directional tug of war – and they push a stock lower.
In real life – using a 3-minute chart – it looks like this…
Each and every day, tracking these powerful “W” and “M” formations can generate daily wealth for you. They happen all the time. You just need to know what you’re looking for!
Every day inside The War Room (which is our live, real-time trading portal), the moment either pattern triggers, you’ll be alerted.
But before getting more into detail on The War Room, let’s move on to secret No. 4…
Trading Secret No. 4: The Black Candle of Death
This secret gives you an early indication of key reversal moments. It’s one of the most elusive – but powerful – indicators you’ll ever use.
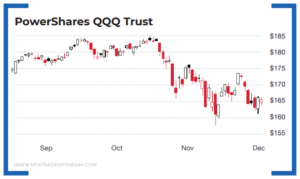
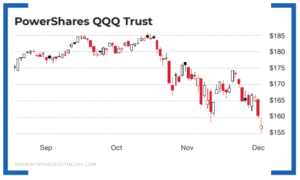
To show you how it works, look at the chart of the PowerShares QQQ Trust (Nasdaq: QQQ) from October to December 2018 shown here. See anything striking about it?
 If you are able to see this formation occur in real-time, and if it’s traded quickly and correctly, you can net profits – really fast.
Specifically, you’ll notice that each time a black candle formed at the top of an upside trend line, the markets fell sharply shortly thereafter. We call this the “Black Candle of Death.”
Consider our trade from Tuesday, December 11, at 10:15 a.m.
In a message to his subscribers titled “Another Ominous Black Candle,” Bryan saw this formation occur, and he immediately recommended the PowerShares QQQ December $160 puts for $1.40 per contract.
Two hours later, at precisely 1:44 p.m., the PowerShares QQQ chart looked like this:
But more importantly, the PowerShares QQQ puts that we bought were already up 47%. If you’ll notice, the black candlestick formation was gone, replaced with a red candle.
The secret here is that the Black Candle of Death presents itself only for a short period of time. So unless you’re watching in real-time, you’ll never see it.
That’s why being made aware of this formation in real-time is invaluable. Those who knew about it and acted properly made 47% in two hours. Those who didn’t simply missed out on yet another profit opportunity.
Trading Secret No. 5: Earnings Strangles
The last and final trading secret is an options trading strategy that’s used to play earnings reports. As you know, earnings are when a stock makes the biggest moves. This is when you want to be involved. But how do you know which way an earnings reaction will go? In short, you don’t.
But luckily, that doesn’t matter.
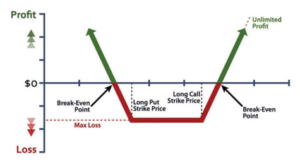
You see, in simple terms, an earnings strangle is initiated by simultaneously buying an out-of-the-money call option paired with an out-of-the-money put option.
This establishes a position with (theoretically) unlimited profit potential to the upside while limiting any downside losses to a predetermined amount. That way, you’ll have a balanced position of calls and puts on the same underlying asset and same maturity (expiration date) but with different strike prices.
Getting positioned on both sides of a trade is called a “strangle.” Here’s what the profit-loss structure of such a strategy looks like:
How It Works
An earnings strangle is initiated by simultaneously buying an out-of-the-money call option paired with an out-of-the-money put option. This establishes a position with (theoretically) unlimited profit potential to the upside while limiting any downside losses to a predetermined amount.
The goal is to profit off a big earnings reaction in either direction – up or down. When executed correctly, traders can profit from a sizable price movement without knowing the direction.
Real-Life Example
Let’s say Caterpillar (NYSE: CAT) stock is trading for $96.75 and the company is scheduled to report earnings on April 25.
You could establish a $3 earnings strangle by buying the following options…
- Caterpillar April $97 calls expiring April 28 for $1.50
- Caterpillar April $96.50 puts expiring April 28 for $1.50
Prior to the earnings release, you don’t know whether Caterpillar will beat earnings or disappoint.
However, you do know that as long as the stock moves at least 5% on earnings day – either up or down – you will turn a profit on your strangle position.
As it happens, Caterpillar surprises with strong earnings and the stock jumps from $96 to $104 – an 8.3% gain. In turn, your calls gain 367%, while your puts expire worthless.
That’s because the substantial gain from the calls far outweighs the small loss from the puts.
Alternatively, if Caterpillar disappoints with weaker-than-expected earnings numbers and the stock falls from $96, as long as it falls at least 5%, you also make money on your trade!
Advantages
Earnings reactions are often the largest single-day moves a stock makes all year. That’s precisely when you want to be involved because that’s when the money is made.
Earnings strangles have distinct advantages…
- You know the exact timing of every trade ahead of time. Every earnings announcement is scheduled in advance, allowing you to plan your entry and exit orders accordingly. This way, you’ll never miss a
- You have zero directional risk. While most traders look to predict a stock’s post-earnings direction, this strategy removes all of the guesswork. By playing both directions together, all you care about is the magnitude (again, not the direction) of the move. In the example above, if the stock moves 5% (or more) on earnings day, you
- You don’t need to act fast or quickly trade in and out to get the best As long as the stock reacts enough to move the needle, the gains will be sustained throughout the session on earnings day.
- You can manage and allocate your capital more Because you know the buy and sell dates in advance, you can anticipate what will be tied up in the market versus what’s available in cash. This way, you’ll know how much to put into each trade.
In our experience, earnings strangles are consistently the most profitable trading strategy.
When it comes to earnings, most traders swing for the fences and speculate in one direction – either up or down. Sometimes they win. Other times they lose. It’s always a coin flip.
By trading earnings strangles with us, your odds increase significantly. Instead of guessing the right direction, you play an inexpensive call option and an inexpensive put option simultaneously.
This way, the directional risk is eliminated.
When done correctly, if the stock moves enough on earnings day, you always win. Even factoring in some earnings clunkers, the chances of 100%, 200% or even 450% returns are in your favor.
Bryan Bottarelli