Institutional Money Made a Choice. This Chart Shows Where They Went.
Healthcare does not care about tariffs. JNJ is proving it.
While the S&P 500 is flat on the year, Johnson and Johnson is up over 17%.
That kind of separation does not come from momentum traders chasing a name. It comes from institutional money making a deliberate decision about where it wants to be.
The business is what sent them there.
Q4 2025 revenue came in at $24.56 billion, up 9.1% year over year and ahead of estimates.
The oncology segment is driving the growth. Darzalex and Carvykti are gaining share in multiple myeloma, one of the most aggressively treated blood cancers in the world.
The MedTech segment grew 7.5%, led by cardiovascular and surgical products. The company pushed through 51 drug approvals and submissions in 2025 alone.
Management guided 2026 adjusted earnings to $11.53 per share on $100.5 billion in revenue. They issued that guidance in January, before the tariff noise and the geopolitical mess.
JNJ’s revenue comes from pharmaceuticals and medical devices. Those do not sit in shipping containers at a port waiting to get repriced.
The chart is catching up to the business.
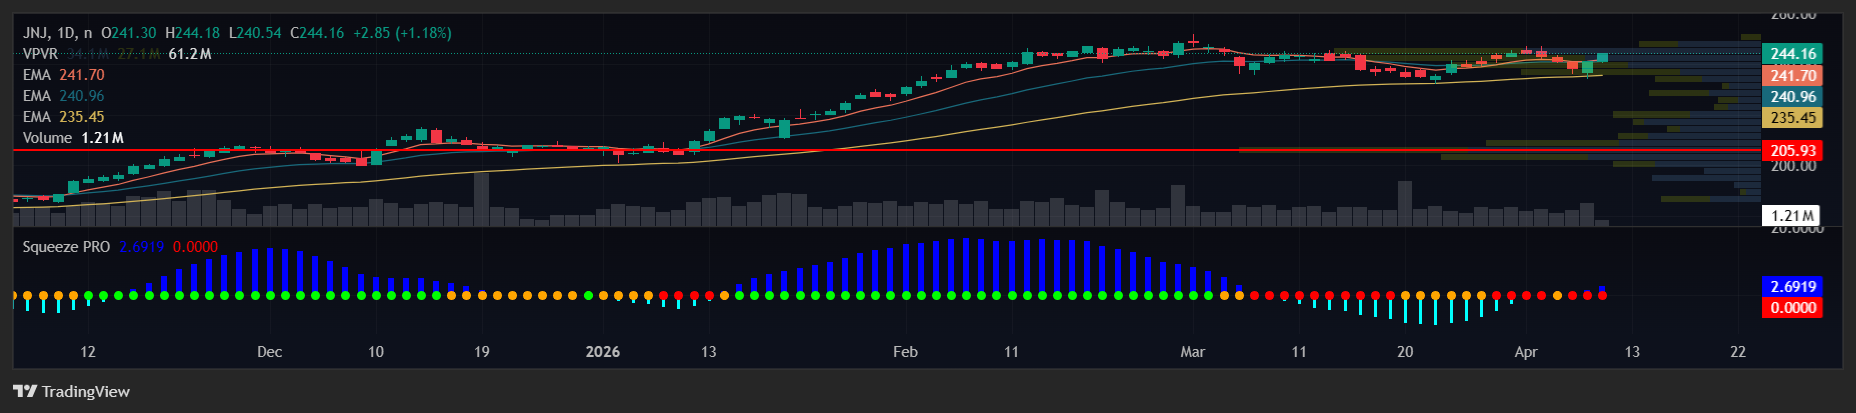
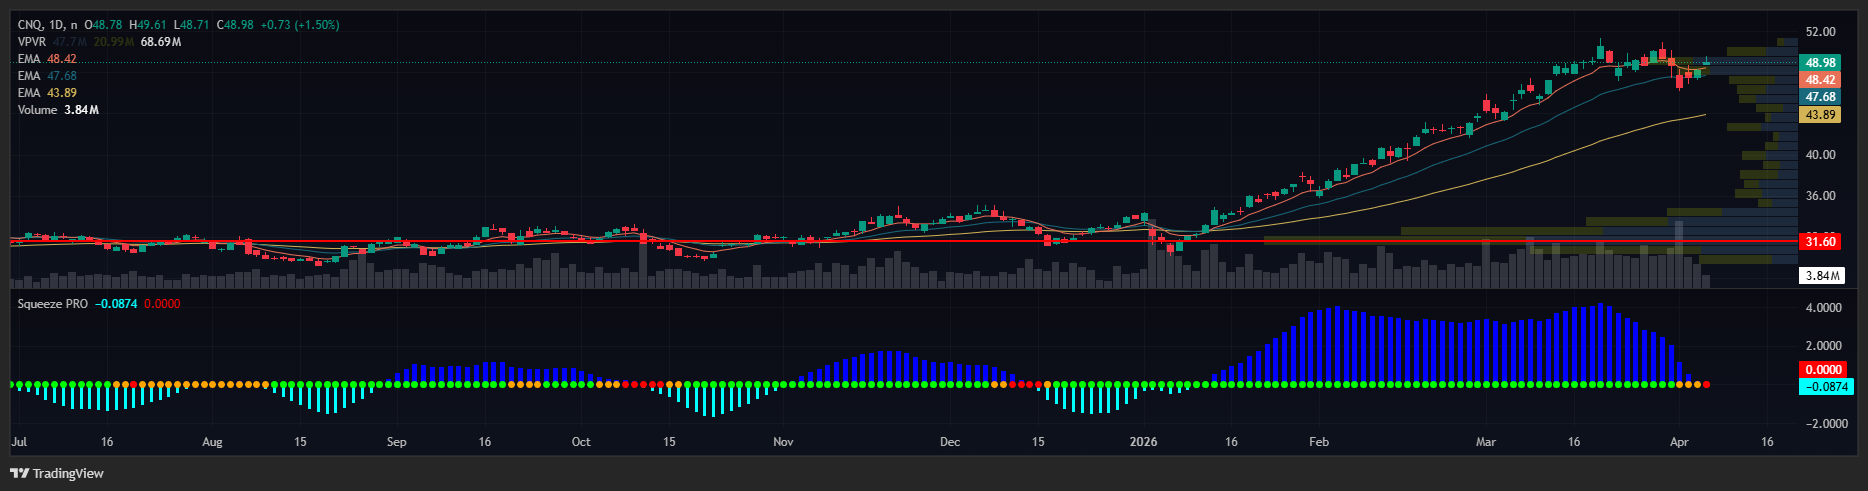
EMAs are stacked on both the daily and the weekly timeframe. An EMA, or exponential moving average, is a line that tracks the average price of a stock over a set period, weighted toward recent prices.
When the short-term EMA sits above the longer-term EMA and both are rising, it means buyers have been consistently in control across multiple timeframes, not just one.
The 8-day EMA is above the 20-day on the daily chart, both are trending higher, and price is sitting well above the 200-day moving average at $195.
RSI is sitting at 52. RSI measures momentum on a scale from 0 to 100, where values above 50 indicate that buyers are in control.
At 52, this stock is not overbought. There is room to run before it gets extended.
The stock has been consolidating in a tight range just below the highs near $248. That level has acted as a double top, meaning price has tested that resistance twice without breaking through.
Sellers have shown up there twice. What happens the third time is the trade.
On the daily timeframe, the squeeze has not fired yet. A squeeze is when price compresses into an increasingly narrow range, building energy before a directional move. The tighter the coil, the more significant the release tends to be.
Your Action Plan
Earnings land on April 14. That is next week.
Q1 estimates are calling for $23.6 billion in revenue and $2.68 in adjusted EPS. JNJ has beaten revenue estimates in each of the last four quarters.
The business trend and the chart trend are pointing in the same direction heading into that report.
A strong number here does not just validate the thesis. It removes the last reason for a seller to lean on the double top.
Whether it breaks or fails is the setup. If the squeeze fires and price clears $248 on volume, that changes the conversation.
If earnings come in strong and the stock gaps higher, that double top becomes a floor rather than a ceiling.
I do not yet have a position at JNJ.
When the setup gives me what I need, I will post the trade in Daily Profits Live.