Market Downturn? This Stock Doesn’t Care
Have you ever noticed that there are always a few stocks punching higher, even when the market is in a tailspin?
Wouldn’t it be lovely to find one of those right now to combat these nervous markets?
You’re in luck!
Today, I’m going to reveal a ticker that has enormous potential upside that could come regardless of what happens this week with the Fed or earnings.
You see, even when markets are in a freefall, there are always stocks willing to buck the trend.
B. Riley Financial (RILY) was that stock for me through most of the Spring.
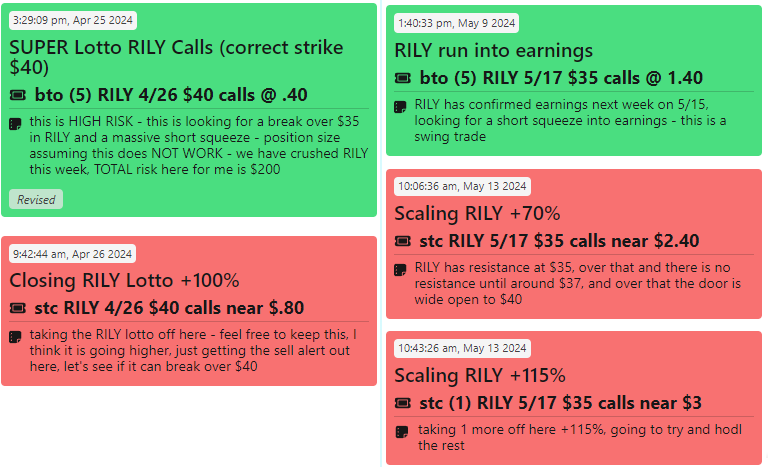
These were some great wins in Daily Profits Live.
However, there’s one stock that’s got all my attention at the moment…Lemonade Inc. (LMND).
Here’s why…
An Edge Like No Other
Short squeezes are one of the most powerful edges you can use to your advantage.
It has the ability to turn breakouts into meltups.
While I don’t expect a return to the days of GameStop and Roaring Kitty, there are still plenty of stocks primed for a squeeze.
So, the first thing I have to do is find the short float percentage for the stock I’m watching.
This tells me the percentage of shares sold short out of the total shares available to trade.
Most stocks sit in the low single digits. However, traders will press shorts on stocks like Lemonade and B. Riley, where they see signs of trouble.
While that may work a majority of the time, the gains they earn are a fraction of what they can lose when a short squeeze occurs.
This chart for B. Riley shows how powerful these trades can be.
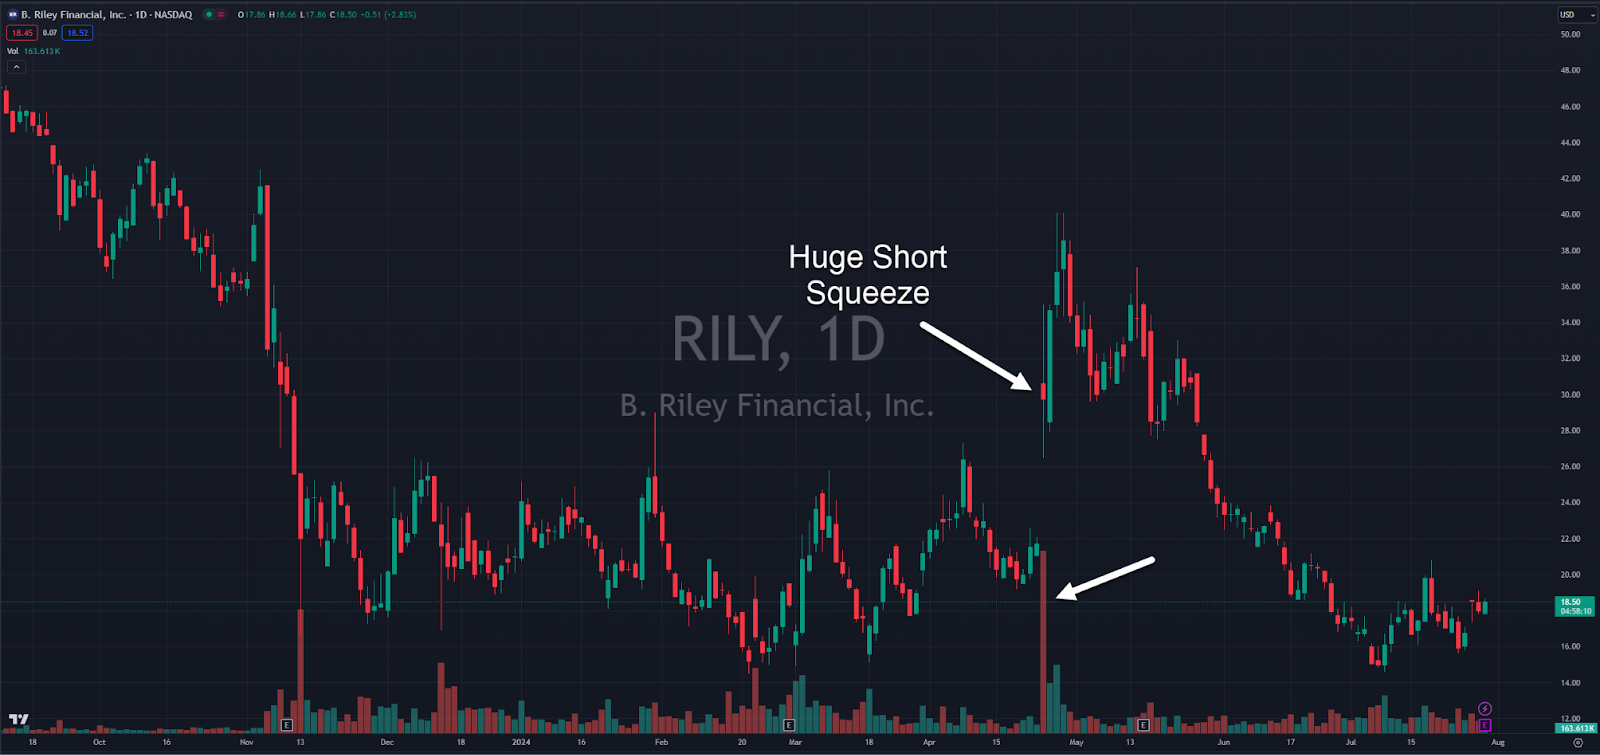
Using call options, I have a clearly defined risk in case the stock collapses while giving myself enormous returns if the stock shoots higher.
Sure enough, B. Riley ripped on extremely high volume that launched shares into a double over just a few days.
Right before this stock jumped, the short float percentage was 75%.
So, why do short squeezes cause such powerful moves?
Traders short stock on margin because, in theory, the shares could go to infinity. So, they need to have a funding backstop.
As the share price rises, their losses grow.
At some point, the broker tells them to cut their losses and exit the position. This forces them to buy back the stock to close out, which creates more buying pressure. In turn, this sends the price higher, causes more losses, and you start to get a cascade of buying.
Now that we understand what’s happening let’s dig into Lemonade.
Why Lemonade
Let’s start off with the obvious – Lemonade has a 32.6% short float percentage.
It’s not as high as I saw on B. Riley, but it’s still high enough to cause a short squeeze.
However, a short squeeze is only valuable if we have a setup likely to create one.
That’s why I look for a TPS pattern.
While I’ve discussed this before, it’s important to understand why it works so well with short squeezes.
The pattern is comprised of three components:
- Trend: A clear upward trend or hard push higher
- Pattern: A consolidation pattern near the highs where the price range contracts
- Squeeze: An indicator that identifies when the Bollinger Bands move inside the Keltner Channel.
You can get a TPS setup on one or multiple timeframes.
Below is the one for the hourly chart:
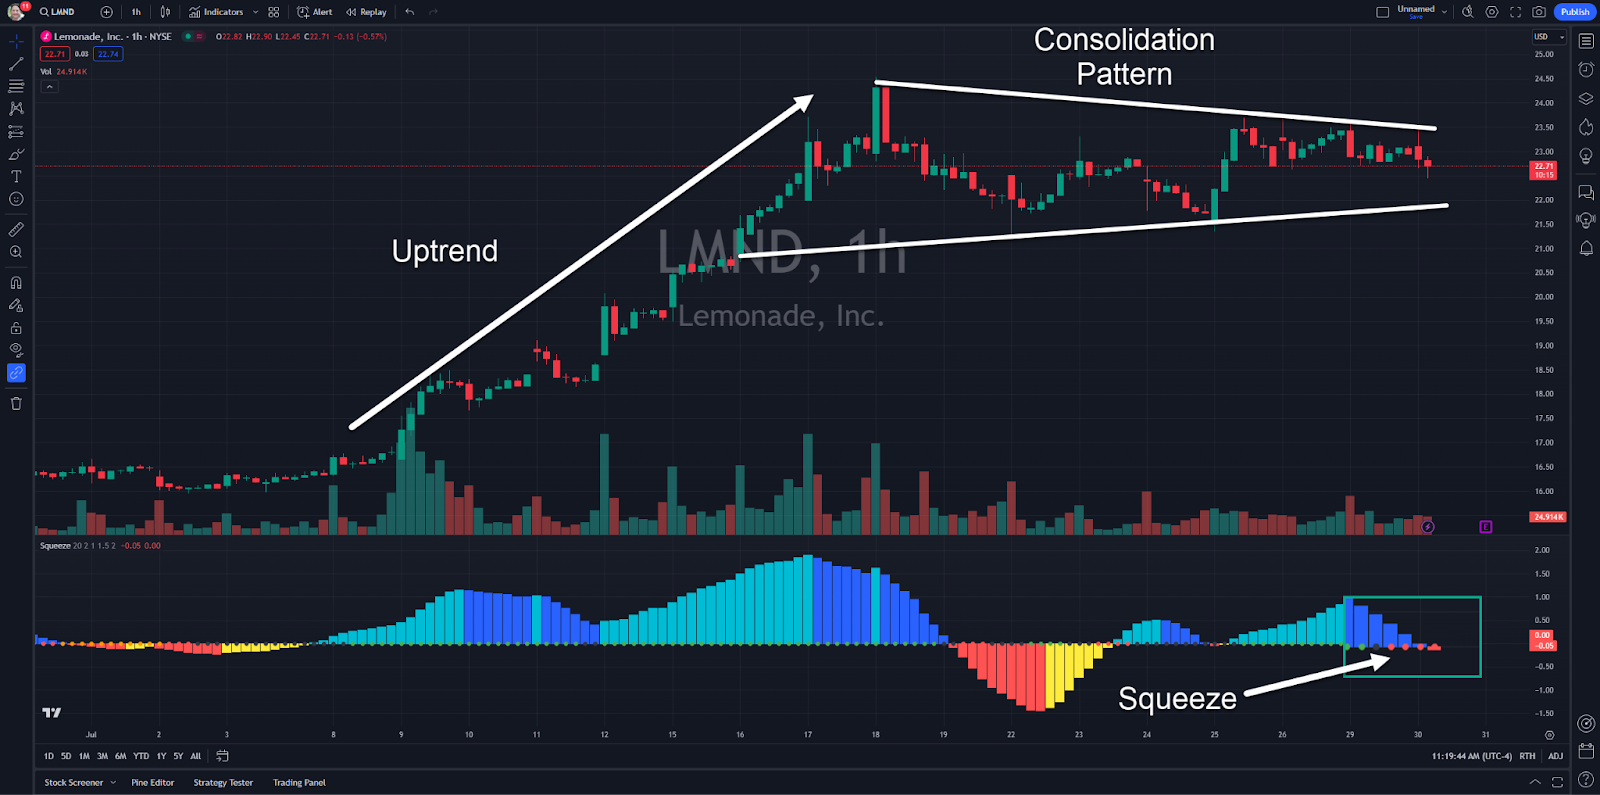
Lemonade pushed higher through the first 2/3rds of July.
Recently, it has traded in a narrowing range between $21.50 and $24.50.
At the bottom, I’ve zoomed in on the squeeze indicator where the dots have turned red indicating the Bollinger Bands are now inside the Keltner Channel on this timeframe.
If you go through different timeframes, you’ll notice a TPS setup on the 15, 30, 60, and 130-minute charts.
Now, let’s talk about how a short squeeze fits into this.
Lemonade’s is near its highest levels in a year.
So, there is a very good chance traders are short this stock with stops against the high.
You’ll see the same thing happen when stocks are near all-time highs (which are even better).
Because I have a good idea of where their stops are, and the short float percentage is so high, buying calls up here defines my risk while giving me a good shot to ride a stock that can push higher quickly.
When I explained this trade out to members in Daily Profits Live, I pointed to $30 as a target for the stock if it breaks through its recent high at $24.50.
You can see this important spot in the weekly chart below.
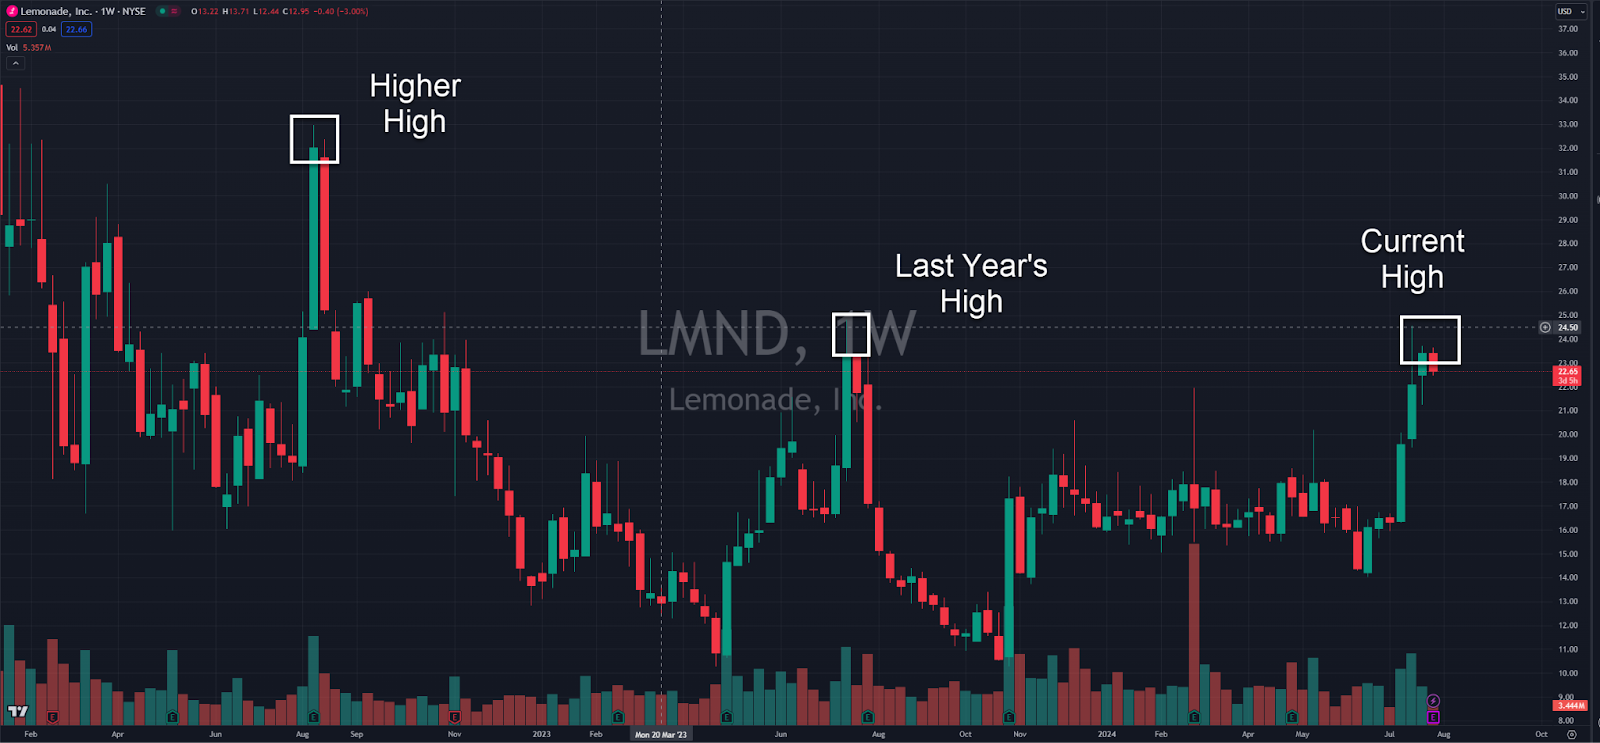
Price is currently on top of last year’s high. If we break through that, the next natural resistance level is $30, where the stock topped out in August 2022.