My Favorite Indicator to Read Market Direction
I could have been staring at some serious losses last week. After all, the market’s sharp decline caught many off guard.
Luckily, I was positioned correctly.
But to be honest, it had nothing to do with luck.
And it all had to do with one indicator that I want to introduce you to.
Reading the market direction is crucial, but it doesn’t have to be difficult.
Yet, most traders never bother to try and learn how to determine where the market is going.
They see it as unnecessary if they don’t trade the broader market.
But just because you don’t trade the broader market doesn’t mean you can’t predict where its direction.
And for my money, there’s no better indicator than the NYSE Tick Chart.
You may have heard of it before or even used it yourself.
But today, I’m going to show you some tricks of the trade I picked up along the way to help you fine-tune your market prediction skills.
Tick Chart
In my opinion, the Tick chart is the most underappreciated tool in day trading.
While there are several out there, I use the NYSE Tick chart.
This index tracks the cumulative up minus downticks for the stocks on the NYSE.
If you’re not familiar with the NYSE listings, it includes around 2,200 stocks from heavyweights like Eli Lilly, Berkshire Hathaway, and Walmart to companies with market caps below $20 million.
I like it because it provides a nice cross-section of the market.
My setup uses a 2-minute chart with a 5-period simple moving average. However, I only look at it after the first 15-30 minutes of the main session have passed.
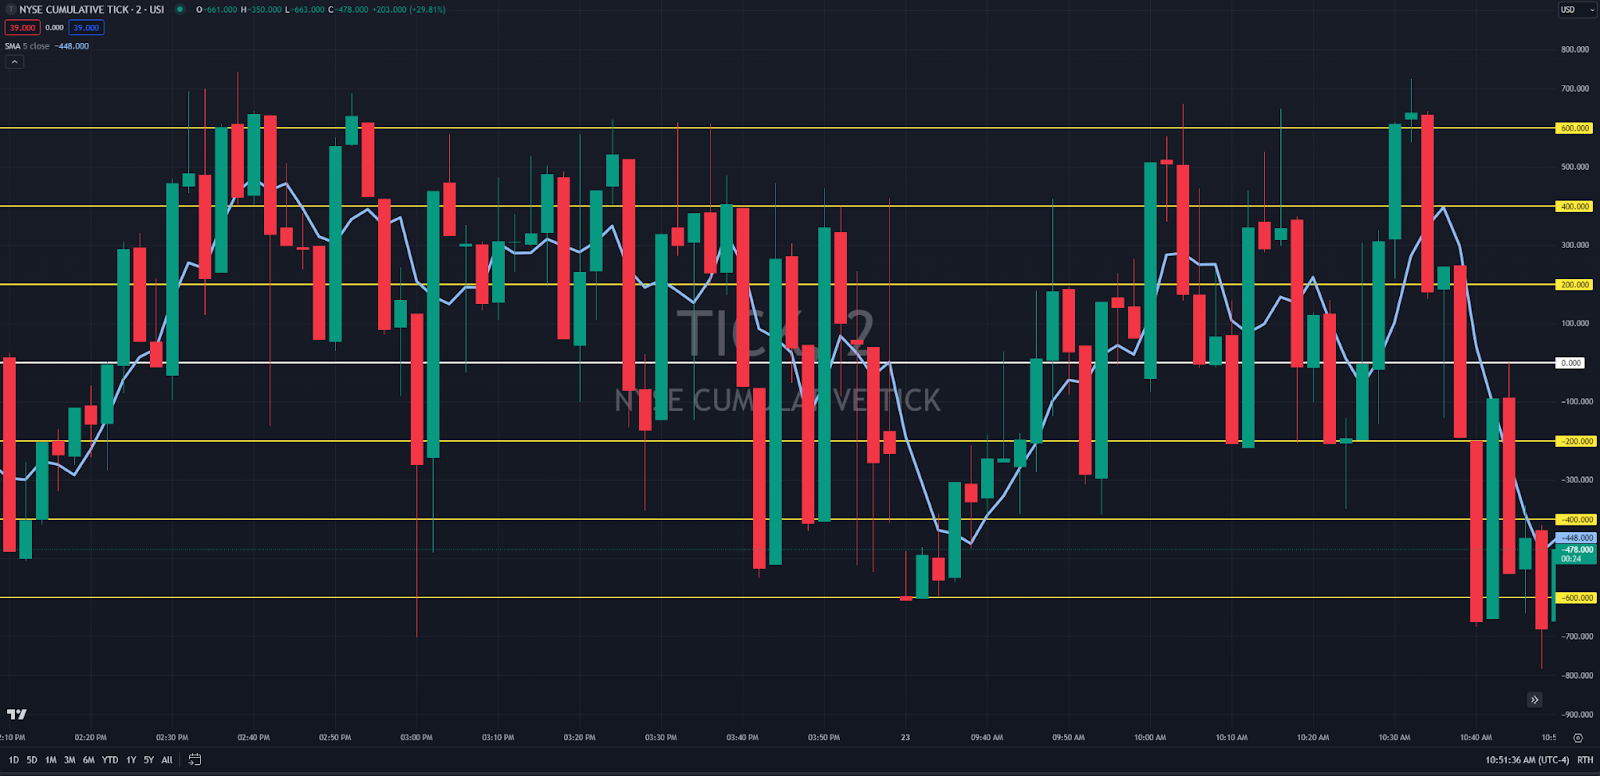
You’ll notice I have yellow lines in increments of 200 between -600 and +600, with a white line at zero.
The light blue line is the 5-period moving average.
I look at this chart to see how broad the strength is across the stocks on the NYSE.
My main objectives are to determine if there is one of two things happening:
- Extreme pressure in one direction or the other
- A divergence between the market and the Tick chart
So, what does extreme pressure look like?
It starts with the Tick index going beyond -600 or +600. Any time the tick chart gets to -1,000 or +1,000, I’m going to sit up and pay attention.
Then, I look to see where the moving average is.
Once the 5-period moving average starts to dip below -600 or rise above +600, then I know there is a lot of broad-based selling or buying going on.
Divergences are a bit more subtle.
This happens when the Tick chart shows bullishness, but the market is trading lower.
For example, if I see the moving average close to +400 and the Ticks at +400, I know there is a lot of buying pressure. So, I would expect stocks to rise.
But if I see buying pressure and stocks aren’t rising, that tells me the market’s internal strength isn’t enough to overcome the downward trend.
Now, there are days when the Tick chart waffles around the zero line.
This happens a lot when markets are grinding higher.
So, while I wouldn’t take it as a bullish signal by itself, I would interpret it to mean I’m unlikely to see a big market move come in and push me off my position.
A Key to Remember
Like a great setup, an indicator works best when you view it in context.
If you’re in a relatively calm bull market and the Tick chart suddenly starts flashing -1000 or worse, it doesn’t mean the top is in. All it’s saying is that at that very moment, there is a lot of selling pressure.
However, if you see the same thing happen for several days, with the Tick chart moving average below -600, and market declines to match, then you have some real information to work with.
When I analyzed the market last week, I saw day after day of heavy selling pressure.
To give you an idea, on 7/18, the Tick chart hit -1000 multiple times that day and even -1200.
The TICK chart has only hit +1000 twice since 7/16, both times at the market open, which is the one time when I said I wouldn’t use it to read the market.
This tells me the sellers are putting pressure on the NYSE stocks each and every day, and that’s something worth noticing.
Does that mean I step away from the market entirely?
Not at all.
It means I need to be smart and strategic about how and when I select my trades.
A big part of that is matching what the Tick chart shows me.
Because when markets bounce, the potential on options trades can be ENORMOUS.
That’s why I’m really excited for next Monday.
Let’s just say I see a lot of things coming together, creating the conditions for a turbo-charged trade.
You have to hear this crazy story because I wouldn’t have noticed this happening without the help of AI.
– Nate Bear, Lead Technical Tactician