5 Millionaire Trader Patterns Exposed: The Self-Made Wealth Playbook
You’re about to embark on a journey that could change the way you look at the stock market forever.
In your possession is a blueprint for extracting capital out of the markets from two self-made millionaire traders who have agreed to pull back the curtain on their most powerful strategies.
Bryan Bottarelli and Nate Bear aren’t your typical Wall Street gurus. They’re battle-tested traders who have weathered bull and bear markets alike, emerging not just victorious but wealthy.
Their paths to success couldn’t have been more different – from the bustling trading pits of the Chicago Board Options Exchange (CBOE) to a quiet home office – yet both have achieved what many consider the holy grail of trading: consistent, substantial profits.
In this exclusive report, Bryan and Nate will walk you through the five key patterns that have been the cornerstone of their success.
These aren’t theoretical concepts or outdated techniques. These are the very same strategies they use day in and day out to identify high-probability trades and maximize profits.
Meet Your Mentors
As we prepare to explore the patterns that can potentially transform your trading, it’s crucial to understand the minds behind these strategies. Bryan and Nate have walked very different paths to trading success, but both have achieved remarkable results.
Their stories not only inspire but also provide valuable insights into what it takes to succeed in the challenging world of trading.
Bryan Bottarelli: The Floor Trader Turned Market Tactician
Bryan’s journey into trading began long before he set foot on the CBOE floor.
As a child, he displayed an innate talent for spotting value, selling his Star Wars action figures for 50 times their original price. This early entrepreneurial spirit would later evolve into a formidable trading career.
After graduating from the prestigious Indiana University Kelley School of Business, Bryan dove headfirst into the world of professional trading.
He cut his teeth on the CBOE floor during the height of the tech boom from 1999 to 2000, trading in the bustling Apple computer pit.
Under the mentorship of one of the country’s top floor traders, Bryan honed his skills in real-time, high-pressure situations.
But Bryan’s ambition didn’t stop there. Recognizing the true value of the methods he’d learned, he took a leap of faith.
In 2006, he left the trading floor to launch his own independent trading research service, Bottarelli Research.
For over a decade, he provided precise trading instructions to an elite group of followers, many of whom were with him from day one.
Today, Bryan is the Head Trade Tactician at Monument Traders Alliance, where he focuses on shorter-term trades, including overnight strangles and options that expire the same day they’re purchased (0DTEs).
His approach combines the hands-on knowledge gained from floor trading with sophisticated charting techniques, allowing him to identify unique opportunities and deliver remarkable gains while strictly limiting risk.
Bryan’s Trading Philosophy: “In trading, as in life, the biggest risks often come with the biggest rewards. The key is knowing how to manage those risks effectively.”
Nate Bear: From Construction to Multimillion-Dollar Trader
Nate’s path to trading success is a testament to the power of determination and continuous learning. After graduating from Georgia Tech in 2005 with a degree in building construction, Nate initially followed the traditional corporate path.
However, the 9-to-5 grind quickly lost its appeal, and within two years, he had started his own small business.
Nate’s trading journey began modestly in 2008 with just a $1,000 account. Like many beginners, he faced significant challenges at first, blowing up not only his initial $1,000 account but also a subsequent $10,000 account.
However, these setbacks only fueled his determination to succeed.
The turning point came in 2015 with the birth of his son. Nate realized that his true goal wasn’t just about making money – it was about creating a lifestyle that allowed him to spend more time with his family.
This revelation drove him to approach trading with renewed focus and dedication.
Nate’s breakthrough came when he started treating trading like a business. He sought out a trading community, connected with successful traders, and discovered a system that delivered consistent wins.
By 2016, he was trading full time, and within a couple of years, his trading portfolio had surpassed $1 million.
In fact, in a span of four years he managed to turn a $37K trading account into $2.7 million. That’s a mind-blowing 7,197% return in four years.
Today, Nate is not only a successful trader but also a mentor to others.
Through his trading communities, Profit Surge Trader and Daily Profits Live, he shares his insights, strategies, and real-time setups with aspiring traders.
The Importance of Pattern Recognition in Trading
Before we dive into the specific patterns that Bryan and Nate use to generate consistent profits, it’s crucial to understand why pattern recognition is such a fundamental skill in trading.
The Market as a Repeating Cycle
At its core, the stock market is driven by human behavior – fear, greed, excitement, and panic. These emotions tend to manifest in predictable ways, creating patterns that repeat over time.
As the famous saying goes, “History doesn’t repeat itself, but it often rhymes.” This is particularly true in trading.
While no two market situations are exactly alike, certain setups and price movements tend to recur. By learning to recognize these patterns, traders can…
- Anticipate potential market moves
- Identify high-probability trading opportunities
- Determine optimal entry and exit points
- Manage risk more effectively.
The Edge of Pattern Recognition
Successful traders like Bryan and Nate have honed their pattern recognition skills to gain a significant edge in the market. Here’s why these are so powerful:
- Objectivity: Patterns provide a systematic, rules-based approach to trading, helping to remove emotional decision making.
- Probability: While no pattern works 100% of the time, recognizing high-probability setups can significantly improve your win rate.
- Risk Management: Patterns often come with clearly defined risk levels, allowing for precise stop-loss placement.
- Versatility: Effective patterns work across different market conditions, time frames, and asset classes.
- Efficiency: Once you’re adept at spotting patterns, you can quickly scan multiple charts to identify opportunities.
The Science Behind Pattern Recognition
Pattern recognition in trading isn’t just about visually identifying shapes on a chart. It’s backed by statistical analysis and, often, complex algorithms.
Many patterns have been studied extensively, with their effectiveness measured across vast amounts of historical data.
Moreover, as more traders recognize and act on these patterns, they can become self-fulfilling prophecies to some extent.
This is particularly true for widely known patterns, which can create a snowball effect as more traders jump in, further validating the pattern.
From Novice to Expert: The Pattern Recognition Journey
Developing strong pattern recognition skills is a journey. It starts with learning to identify basic chart patterns and understanding their implications.
As you gain experience, you’ll start to recognize more nuanced setups and understand how different patterns interact with each other and with other technical indicators.
The true power comes when pattern recognition becomes second nature – when you can glance at a chart and immediately spot potential opportunities.
This is the level that traders like Bryan and Nate have reached, and it’s what allows them to consistently find profitable trades in various market conditions.
In the following sections, we’ll explore the five key patterns that Bryan and Nate have used to build their trading fortunes.
By mastering these patterns, you’ll be well on your way to developing the kind of pattern recognition skills that can transform your trading.
Remember, pattern recognition is not just about memorizing shapes on a chart.
It’s about understanding the market psychology behind these patterns and learning to read the story that each chart tells.
Let’s begin this exciting journey into the world of millionaire-maker patterns.
The 5 Millionaire-Maker Patterns
1. The “W” Pattern
According to Bryan, this is the only chart pattern you need to know for making fast profits consistently in the market.
It works on multiple time frames, whether you’re a swing trader or a day trader.
This pattern is also known as a “double bottom” and can be viewed as bullish.
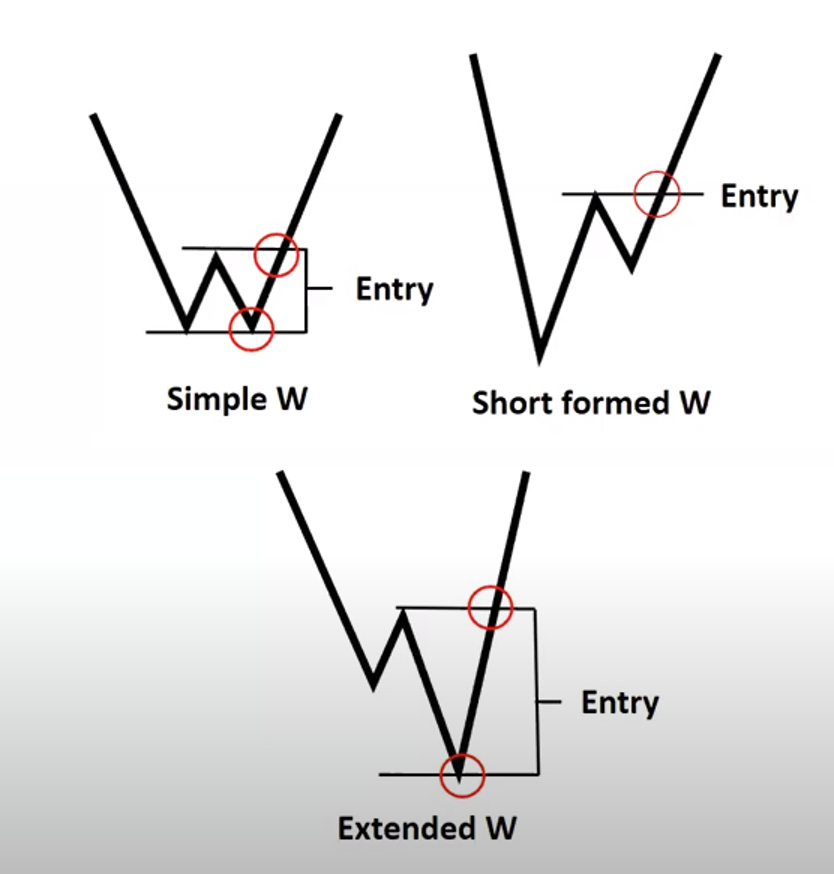
Here’s How the “W” Pattern Forms
The bears push a stock down to the first support level. The stock then bounces. The bears then push it down again. The bulls again support the stock at the same level, which marks the second support level.
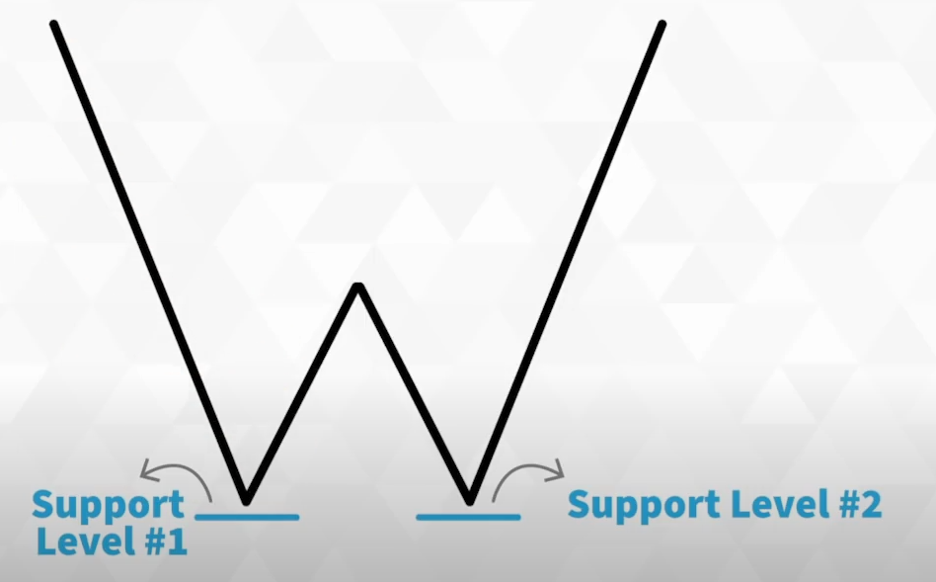
When the bulls trigger the next bounce, you’ve got your “W” pattern formed.
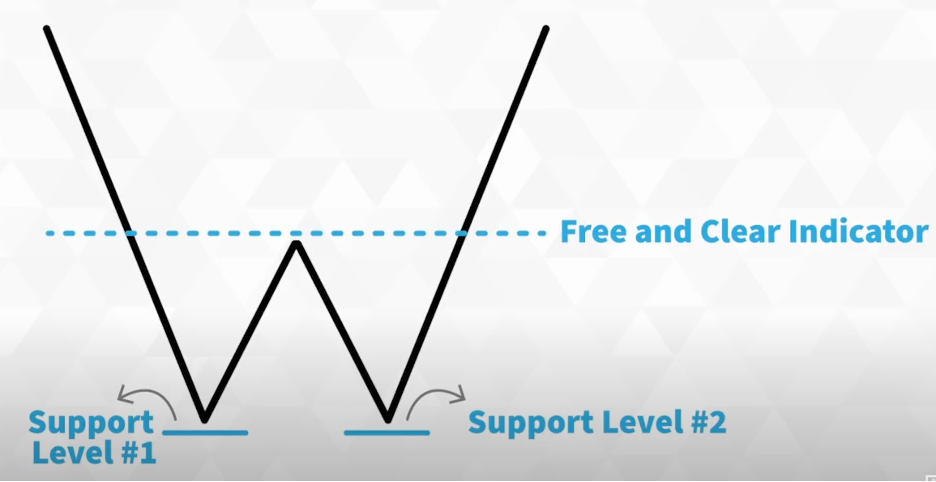
The key is when the stock pushes above what Bryan calls the “free and clear indicator.”
The Science Behind Why It Works
This pattern works because it clearly shows you when the bulls are taking control. You’re seeing the bears try twice to push the stock down, but they can’t break that support. When that stock pops above the middle of the W, it’s like a green light saying the bulls are in charge now.
Real-World Example: Workhorse Group (WKHS)
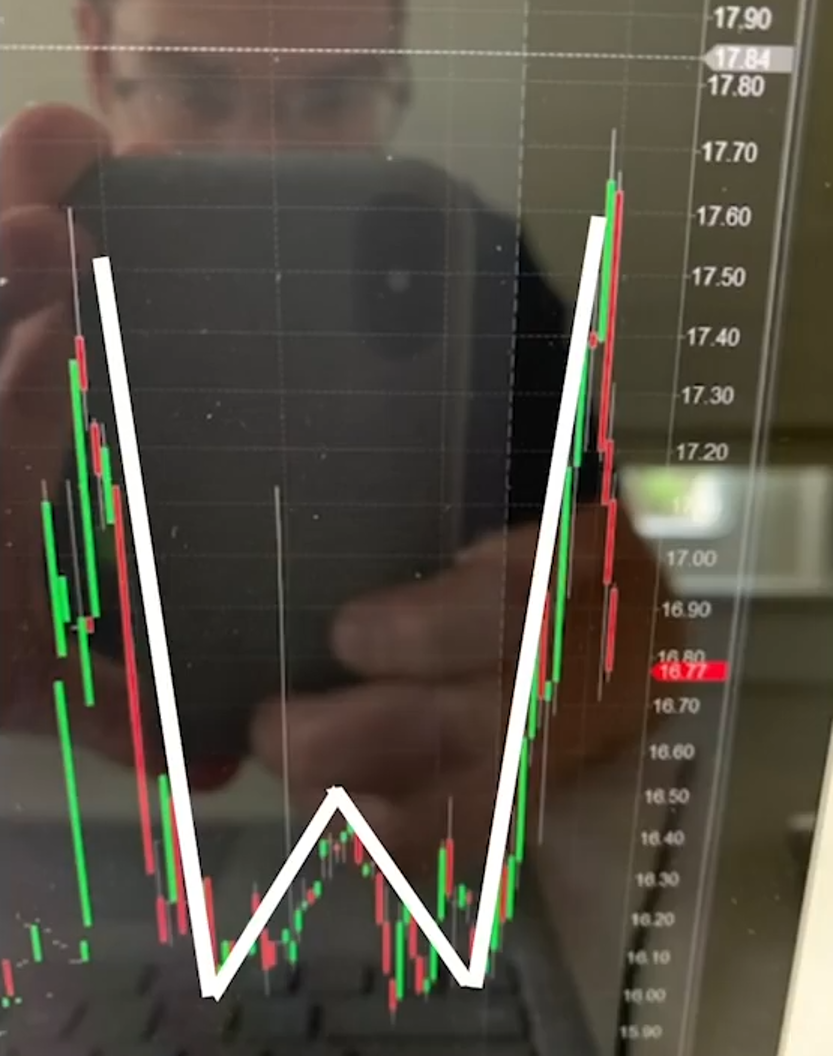
The above image is a picture Bryan took of Workhorse Group’s chart. If you look closely enough, you can even see his reflection.
You can see the bears pushed Workhorse from $17.60 down to $16. And then it bounced to $16.40. The bears tried again, pushing the stock back down to $16. When it crossed above $16.40 the second time, the “free and clear indicator” ignited a long.
The stock shot up to $17.70 just 15 minutes later. And while that might not sound like a big move, if you use options like Bryan does, that modest move higher was good for a 33% gain in just 15 minutes.
Here’s another example…
Tips for Trading This Pattern
- Look for those two clear support points at the same level.
- Wait for the stock to cross above the middle point of the “W” before jumping in.
- This pattern works on everything – tech stocks, blue chips, gold, biotech, you name it.
- Use three-minute price ticks to catch these patterns quickly.
- Remember, this is way simpler than all those complex indicators out there. You don’t need RSIs, MACDs, or Fibonacci retracements – just this one simple pattern.
2. The “M” Pattern
The “M” pattern is the opposite of the “W” pattern. And it’s one that Bryan looks for if he wants to put on a bearish play in a stock. It’s also known as a “double top” pattern.
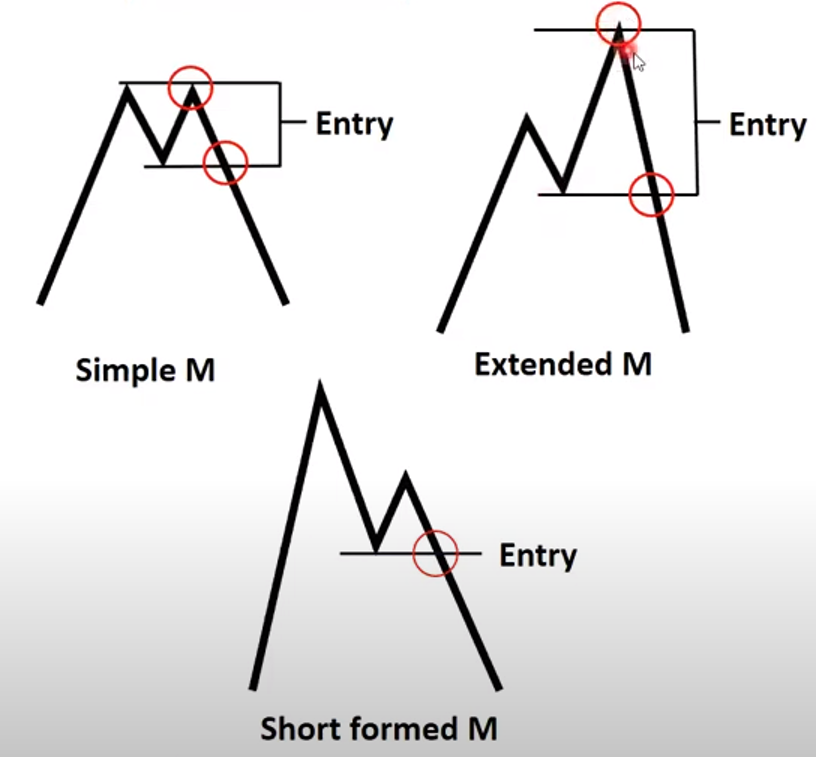
How to Identify the “M” Pattern
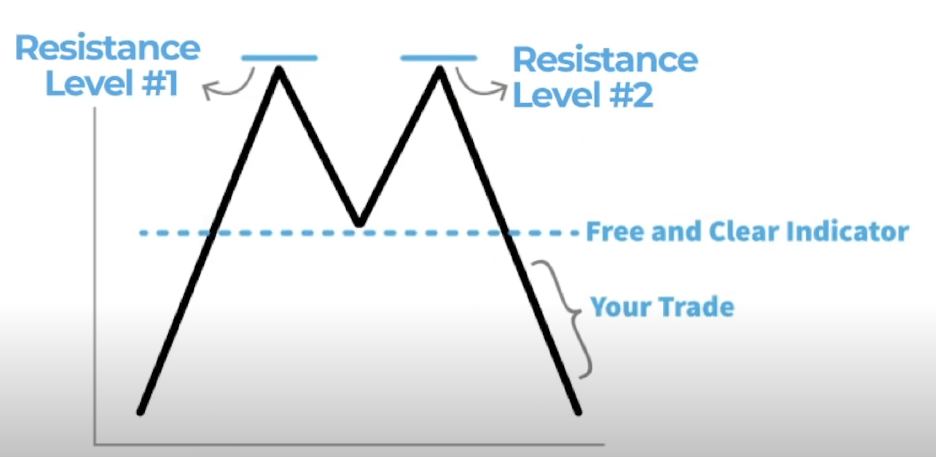
Here you have the bulls pushing a stock up to a resistance level. That’s the first peak of your M. The bears then push it back down. The bulls try again, pushing it back up to around the same resistance level, which is the second peak.
When the bears take control and push it below what Bryan calls the “danger zone” (that’s the line in the middle of the “M”), you’ve got your bearish signal.
The Science Behind Why It Works
Look, this pattern works because it clearly shows you when the bears are taking control. You’re seeing the bulls try twice to break through a resistance level and fail. When that stock drops below the middle of the M, it’s like a neon sign saying the bears are in charge now.
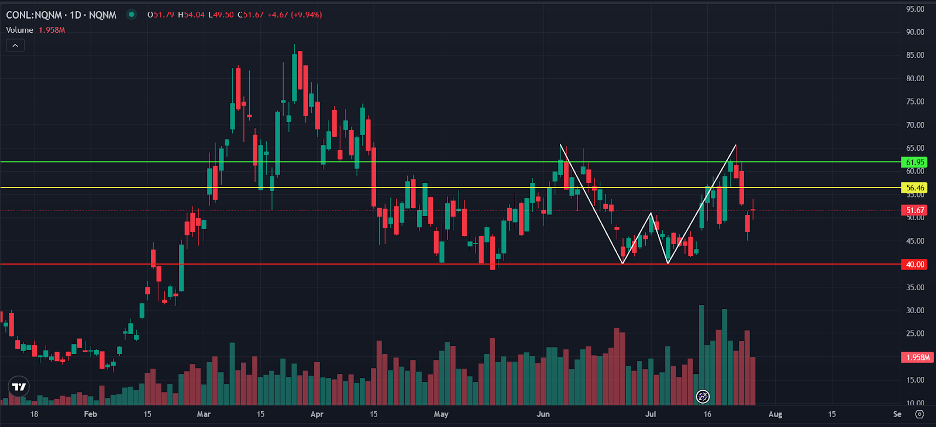
Real-World Example: C3.ai Inc. (AI)
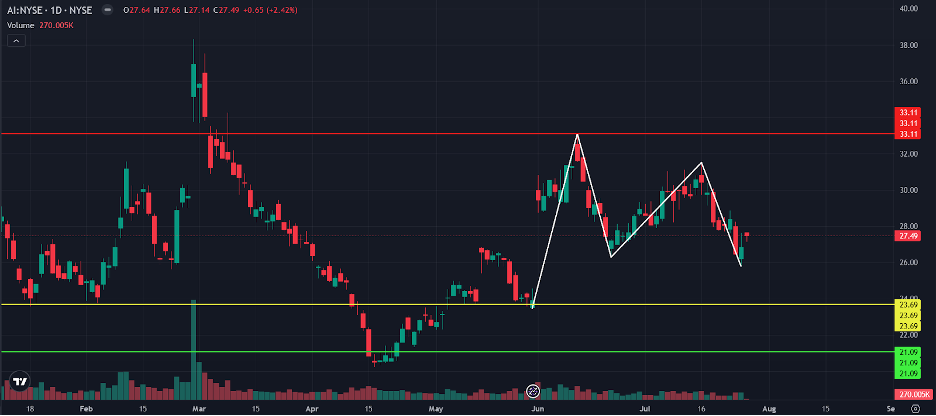
Here we have C3.ai push above $33.11, come back down to the $26.50 level, and then make a run back up to $31.50. The bears push it back down past the “danger zone.”
Tips for Trading This Pattern
- Look for those two clear peaks at about the same level.
- Wait for the stock to cross below the middle point of the “M” before making your move.
- This pattern works on all kinds of stocks, just like the “W.”
- Use those three-minute price ticks to catch these patterns quickly.
3. The Woodpecker Pattern
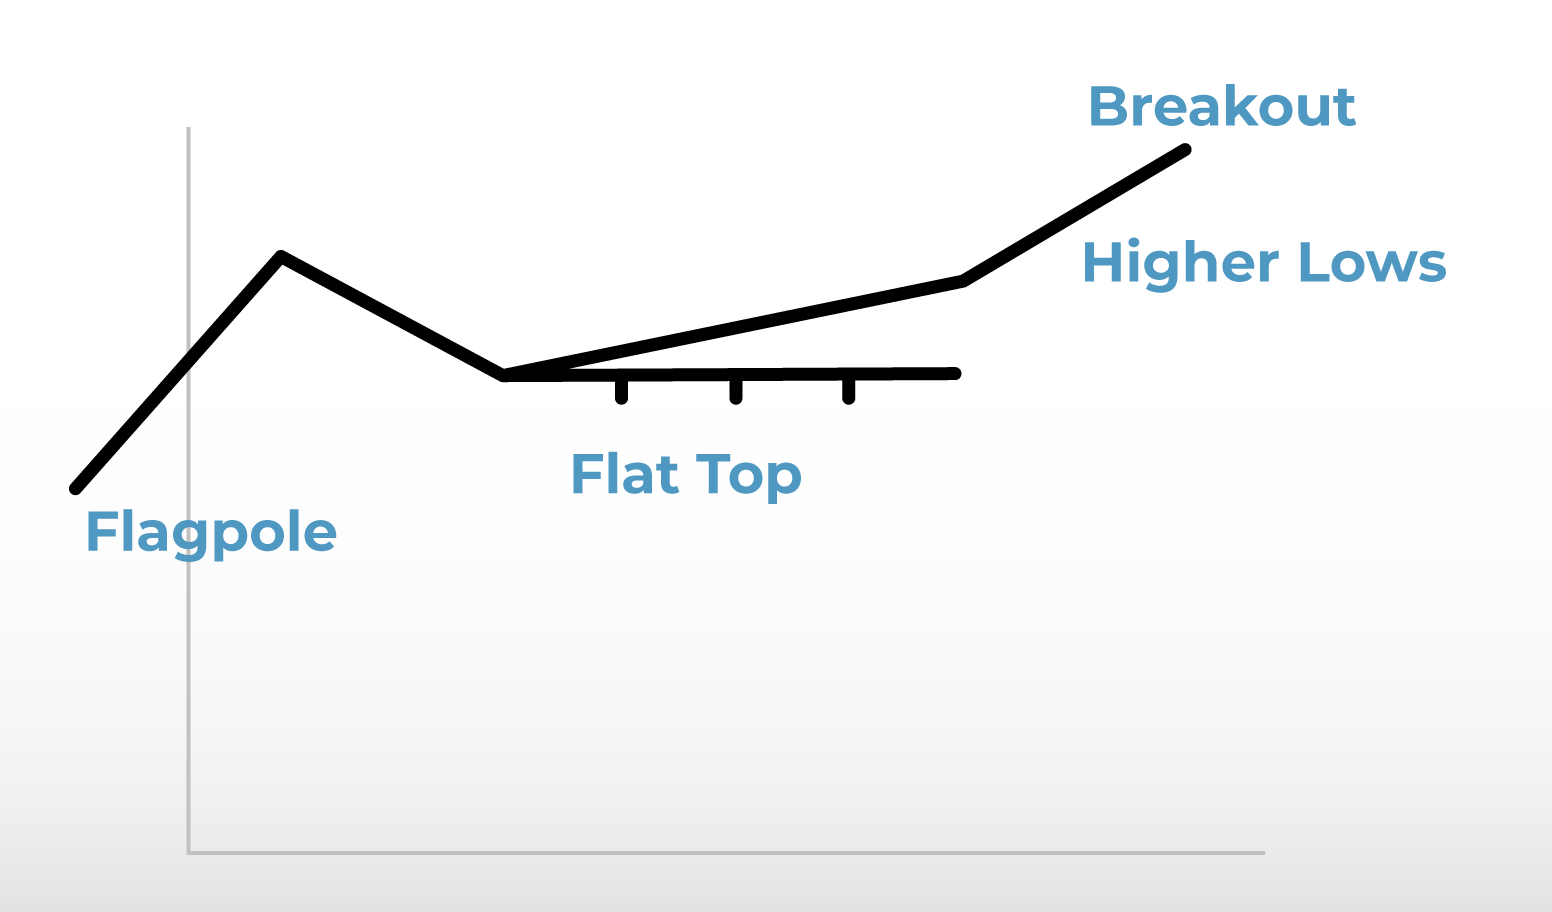
This is a unique setup that’s not quite like a bull flag or a bull pennant, but it’s one of Nate Bear’s favorite patterns to trade. It’s a compression pattern that often leads to significant breakouts and can provide excellent trading opportunities.
How to Identify the Woodpecker Pattern
There’s an initial move higher, creating the “flagpole.” Then there’s a move back down from the high.
You’ll see a flat top where the price gets rejected multiple times. Then a series of higher lows forms, creating a compression.
The pattern completes when the price breaks above the flat top.
The Science Behind Why It Works
This pattern works because it shows a clear battle between the bulls and the bears, with the bulls gradually gaining strength. The flat top represents resistance, while the higher lows show increasing buying pressure. When the price finally breaks above the flat top, it often leads to a significant move up, typically reaching or exceeding the previous high.
Real-World Example: Celanese Corporation (CE)
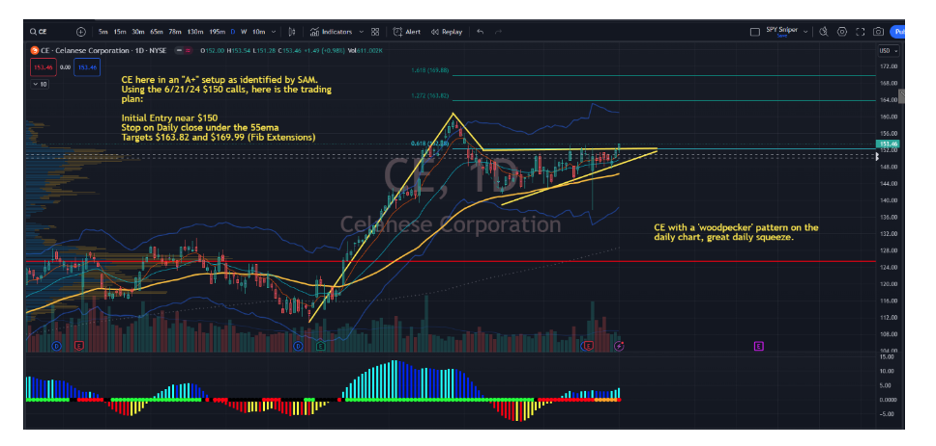
Take a look at Celanese Corporation. It saw a move higher, followed by a pullback. Then it had this flat top where the price was immediately rejected.
It then experienced a series of higher lows forming. This created the compression characteristic of the woodpecker pattern.
According to Nate, this creates a high likelihood of a break above the flat top and a move up to new highs.
Here’s another example from Nate – this one is on Spotify (SPOT).
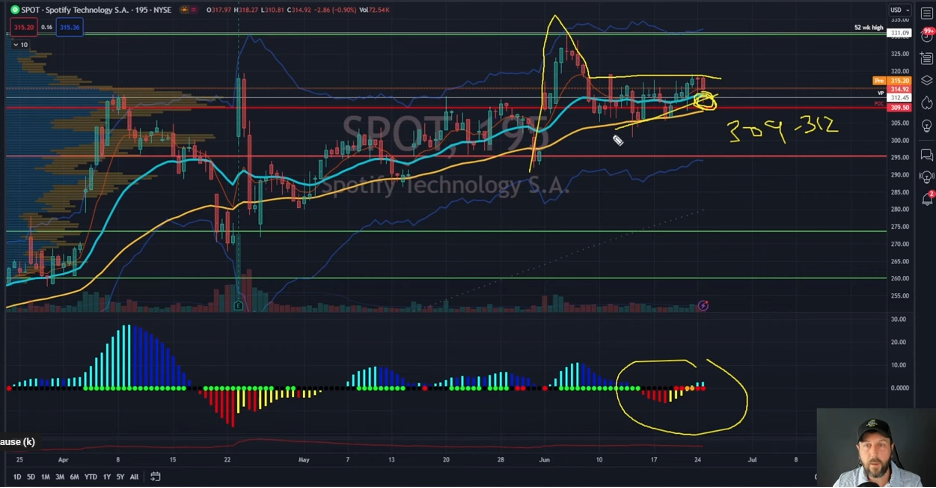
He identifies an A+ squeeze on the 195-minute chart. The stock has formed a woodpecker pattern with a flat top resistance and a series of higher lows.
Nate suggested entering between $309 and $312, using a stop loss under $305, and targeting a new 52-week high above $331.09.
About four weeks later, the stock went on to hit new highs and trade above $346 per share.
Tips for Trading This Pattern
- Look for the pattern on multiple time frames, particularly the 195-minute chart.
- Use options expiring a few weeks out to give the trade time to develop.
- Consider Delta 60 options for a balance of cost and potential profit.
- Place your stop-loss just below the lowest recent support.
- Target new highs or significant resistance levels for profit taking.
- Combine this pattern with squeeze indicators for more reliable signals.
Nate actually uses an AI Scanner to find setups just like this one.
4. Post-Earnings Run-Up Pattern
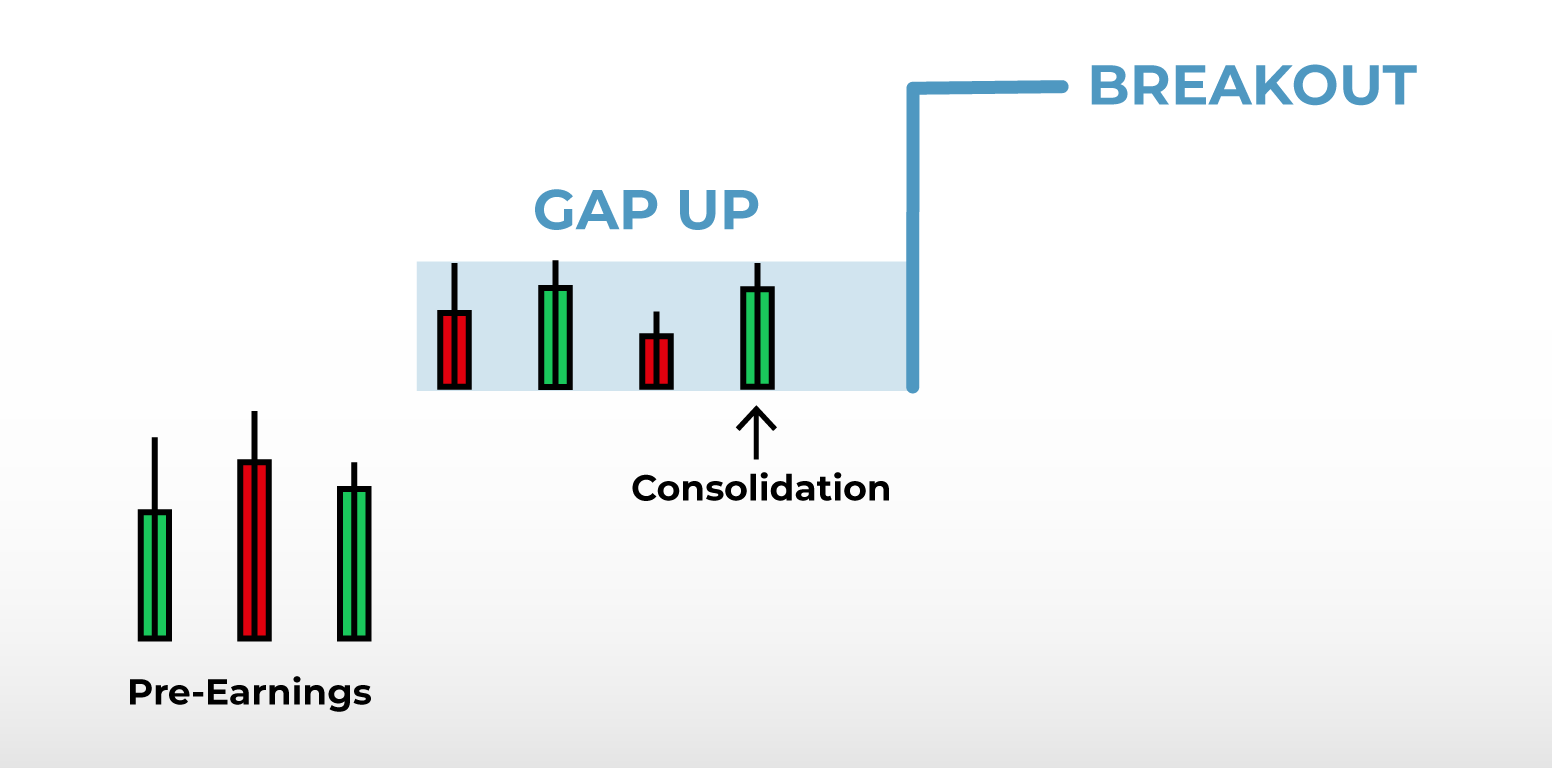
This pattern focuses on stocks that have recently beaten earnings expectations and are showing potential for further upside. It’s a strategy that capitalizes on positive momentum following a strong earnings report.
How to Identify the Post-Earnings Run-Up Pattern
- Look for stocks that have recently reported earnings and beaten expectations.
- Identify a significant gap up in price following the earnings report.
- Watch for a period of consolidation or sideways movement after the initial gap.
- Look for technical indicators suggesting a potential breakout, such as a squeeze signal.
- Confirm the overall market trend is supportive of bullish moves.
The Science Behind Why It Works
This pattern works because strong earnings often lead to increased investor confidence and institutional buying. The consolidation period allows for profit taking and accumulation, setting the stage for the next leg up. When combined with bullish technical signals, it can lead to significant upside moves.
Real World Example: Ulta Beauty (ULTA)
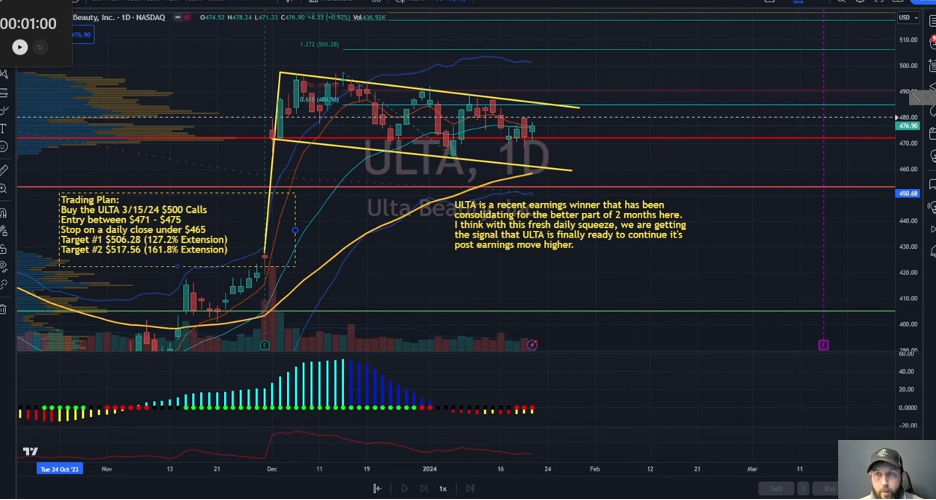
- lta beat earnings, creating a gap up in the chart.
- The stock was moving sideways in a channel since the earnings report.
- A fresh daily squeeze signal had formed (three dots in).
- The stock was no longer overextended like some other market leaders.
- There were clear upside targets at the 1.272 and 1.618 Fibonacci extension levels.
On March 8, 2024, Nate bought Ulta $600 calls expiring on March 15 for $5.90 in his Daily Profits Live portfolio. Six days later, he closed those calls out for nearly $8, a profit of 35%.
Tips for Trading This Pattern
- Consider slightly out-of-the-money calls to balance risk and reward.
- Enter the trade near the point of control or 21 EMA within the consolidation range.
- Set a stop-loss below the low of the consolidation pattern.
- Target Fibonacci extension levels for potential exits.
- Be aware of the overall market conditions and how they might affect the stock.
- Use technical indicators like squeeze signals to confirm potential breakouts.
- Monitor the stock’s behavior relative to its sector and the broader market.
- Be patient during the consolidation phase, waiting for clear signs of the next move up.
- Consider taking partial profits at key resistance levels while letting a portion of the position run for larger gains.
5. Trend, Pattern, Squeeze (TPS)
The Trend Pattern Squeeze is more than just a trading setup – it’s an entire system. It is designed to be simple yet effective, focusing on three key components: Trend, Pattern, and Squeeze.
How to Identify the TPS
- Trend: The stock should be clearly trending either up or down. It should be evident within three seconds of looking at the chart.
- Pattern: Look for either a bull flag (uptrend) or a bear flag (downtrend). This is a period of consolidation near highs or lows.
- Squeeze: Use the Squeeze indicator. When the dots turn red, it indicates a period of consolidation and potential for the next move.
The Science Behind Why It Works
The TPS system works because it combines trend following with pattern recognition and timing. The trend component ensures you’re trading in the direction of the overall market movement.
The pattern helps identify potential continuation setups. The squeeze indicator signals when the stock has had a chance to rest and is ready for its next move, much like a long-distance runner taking breaks between legs of a journey.
Real-World Example: Google (GOOGL)
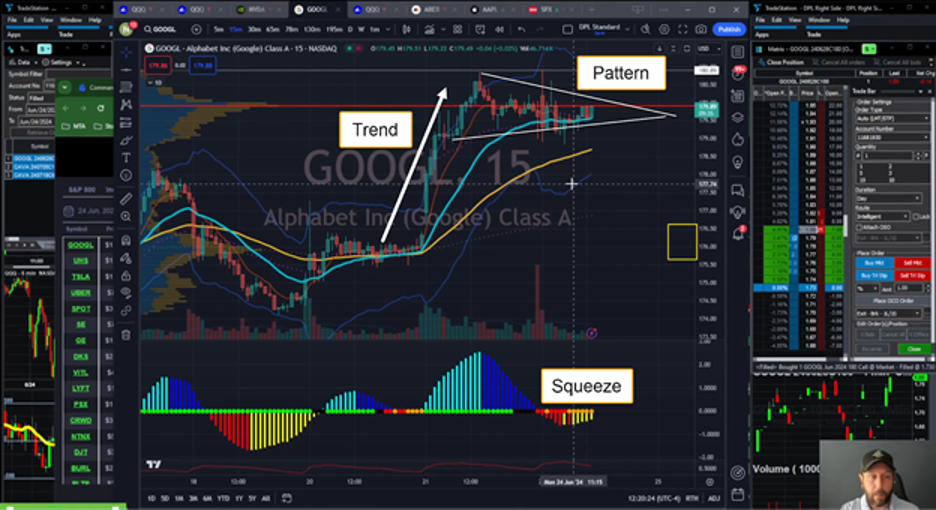
- Trend: This one was a no-brainer. Google was in a clear uptrend.
- Pattern: Now, this is where it gets interesting. At first glance, you might think there isn’t a clearly defined pattern. The solid white lines don’t exactly connect the highs and the lows. That’s okay. The idea is just to get a basic shape where most of the volume is happening in a narrowing range.
- Squeeze: Here’s where things get juicy. Nate was able to detect a valid squeeze at the bottom of the chart (red and orange dots). If you look closely, you’ll see the momentum shifting up, indicating some buying pressure.
All of these elements combine to form a high-quality TPS setup on the 15-minute chart. Nate was able to use options on this play and made a 15% profit in less than 24 hours.
What’s even more impressive, Nate has developed a scanner that finds these exact plays.
For more info on it, click here.
Bonus: The Millionaire Mindset
Embrace Calculated Risk
Top traders understand that risk is an inherent part of trading. Rather than avoiding risk altogether, they learn to calculate and manage it effectively. They know their risk tolerance and stick to it, never risking more than they can afford to lose on a single trade.
Develop Emotional Intelligence
Successful traders have learned to recognize and control their emotions. They don’t let fear or greed drive their decisions. Instead, they remain calm and objective, even in volatile market conditions.
Cultivate Patience
The ability to wait for the right setup is crucial. Top performers don’t feel the need to be in the market all the time. They’re comfortable sitting on the sidelines until the perfect opportunity presents itself.
Practice Discipline
Sticking to a well-defined trading plan is a hallmark of successful traders. They have the discipline to follow their rules, even when it’s tempting to deviate.
Embrace Continuous Learning
The market is always evolving, and top traders never stop learning. They constantly seek new knowledge, whether it’s about market dynamics, new trading strategies, or psychological techniques to improve their performance.
Focus on Process, Not Outcomes
While profits are important, successful traders focus more on perfecting their process. They know that if they consistently make good decisions based on their strategy, the profits will follow.
Maintain a Growth Mindset
Top performers view losses and mistakes as learning opportunities rather than failures. They analyze what went wrong and use that information to improve their trading approach.
Develop Resilience
The ability to bounce back from losses is crucial in trading. Top performers have developed mental toughness that allows them to persevere through tough times.
Maintain Work-Life Balance
Successful traders understand the importance of life outside of trading. They make time for family, hobbies, and self-care, which helps prevent burnout and keeps them sharp when they’re at their trading desk.
Bonus: Pattern Recognition Cheat Sheet
“W” Pattern (Double Bottom)
- What to look for: Two distinct lows occur at approximately the same price level.
- Confirm: Price breaks above the middle peak of the “W.”
- Action: Consider a long position when the price crosses above the middle peak.
“M” Pattern (Double Top)
- What to look for: Two distinct highs occur at approximately the same price level.
- Confirm: Price breaks below the middle trough of the “M.”
- Action: Consider a short position when the price crosses below the middle trough.
Woodpecker Pattern
- What to look for: There’s an initial move up, a pullback, a flat top with multiple rejections, and a series of higher lows.
- Confirm: Price breaks above the flat top resistance.
- Action: Consider a long position on a breakout above the flat top.
Post-Earnings Run-Up Pattern
- What to look for: The company reports a strong earnings beat, which is followed by a gap up in price and a period of consolidation.
- Confirm: Technical indicators (like squeeze) suggest a potential breakout.
- Action: Consider a long position when the breakout signals appear.
Trend Pattern Squeeze (TPS)
- Trend: There is clear directional movement (up or down) visible within three seconds.
- Pattern: There’s bull flag (uptrend) or bear flag (downtrend) consolidation.
- Squeeze: Red dots on the squeeze indicator show consolidation.
- Action: Consider a position in the trend direction when the squeeze releases.
Take Your Trading to The Next Level
Are you ready to transform your trading and potentially join the ranks of successful traders like Bryan and Nate?
Here’s where you can learn more from these trading experts:
Bryan Bottarelli
- Visit Bryan’s free blog here.
- Join his War Room trading community for real-time trade alerts and analysis.
- Visit Bryan’s YouTube channel.
- Check out Bryan’s Catalyst Cash-Outs Live service.
Nate Bear
- Check out Nate’s free blog here.
- Explore his Profit Surge Trader program for in-depth training and live trading sessions.
- Visit Nate’s YouTube channel.
- Check out Nate’s Daily Profits Live service.