The One Indicator Every Day Trader Needs
Hey Gang,
Yesterday, during the LIVE Open House for Daily Profits Live, we watched the S&P 500 drop nearly 100 points.
But for 75 minutes of trading, I sat, watched, and waited.
Finally, I got the signal to step in around 11 a.m.
That’s when I scooped up some short-dated calls in Costco that I turned into a 30% profit in 10 minutes.

My timing was so good I came within minutes of catching the dead lows in the market.
So how did I do it?
Four letters: TICK
Some of you may have heard of the TICK chart before.
Now, I’m going to show you how I combined it with three stocks I’ve had on my watchlist (and still do) to deliver mind-blowing trades.
Timing is Everything
You can have the best trade setup in the world. But it won’t mean a thing if you don’t have the right timing.
Wednesday’s market action had three stocks that were clear outperformers: Cava (CAVA), Nvidia (NVDA), and Costco (COST).
While the S&P 500 was crashing, all of these stocks were either up, flat, or doing better than the S&P 500.
Here’s the thing…I couldn’t just buy these and wait for the markets to turn.
With the amount of selling pressure we were seeing, it’s entirely possible that stocks could have kept falling throughout the day.
So, I needed an edge, something that would clue me into a potential bottom in the markets.
That was the TICK chart.
The TICK chart measures the up ticks minus the down ticks for the around 3,000 stocks traded on the New York Stock Exchange.
I like to think of it as a barometer of the active buying and selling pressure.
When the TICKs turn negative, and start getting below -600, that indicates a sell program is in control.
Conversely, when the TICKs get over 600, it implies a buy program is in charge.
The chart below includes the settings I keep on my platform – a 2-minute timeframe and a 5-period simple moving average (white line).

I want you to look at the left side of this chart. Notice how most of the readings to start the day were below the zero line, often dropping down to -800 or further. The moving average was also comfortably below the zero line as well.
Then, around 11:00 a.m., things changed.
The TICKs moved up to +600 for the first time that day. It then stayed there, bringing the moving average up over the zero line and into positive territory.
Now, take a look at the chart below that puts the S&P 500 index right below the TICK chart.

It’s immediately clear that the indexes found a bottom right as the TICK chart became more bullish.
THIS was my signal to enter the Costco trade. Because up until that point, I didn’t know if the market would keep falling, taking out Costco and everything else with it.
The TICK reversal signal was by no means a guarantee. But, it offered a logical, technical reason as to why the indexes should start to rise.
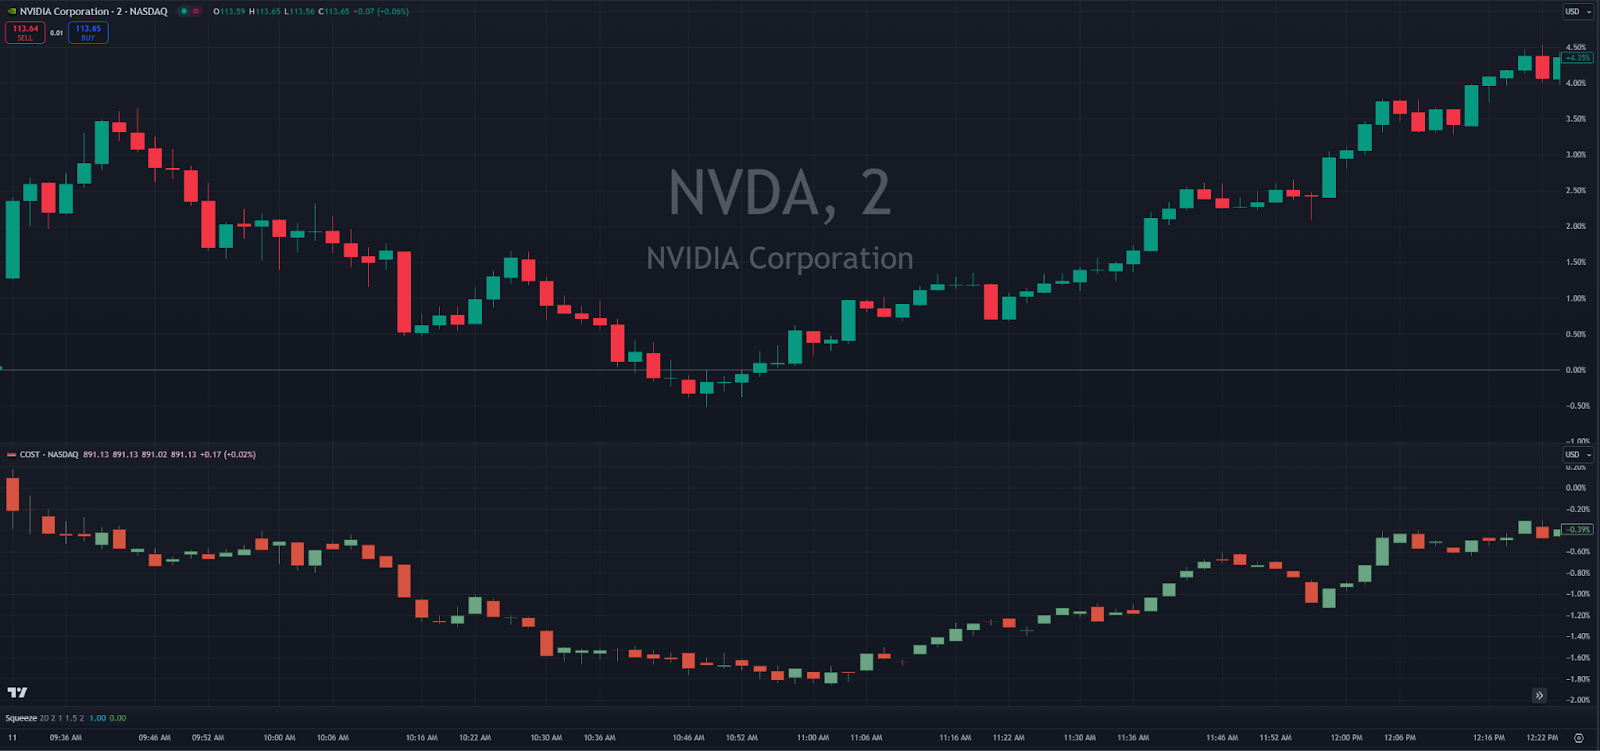
The next chart below shows how that timing aligned perfectly with Nvidia and Costco finding their bottoms.
But What About CAVA?
Cava was the one odd ball of the group.
As a momentum stock with a high short float, it wasn’t trading with the rest of the market.
It started the day strong and held its gains, even as the S&P 500 fell.
If you look at the 30-minute chart, you’ll see this fell into a more traditional setup I like to play.
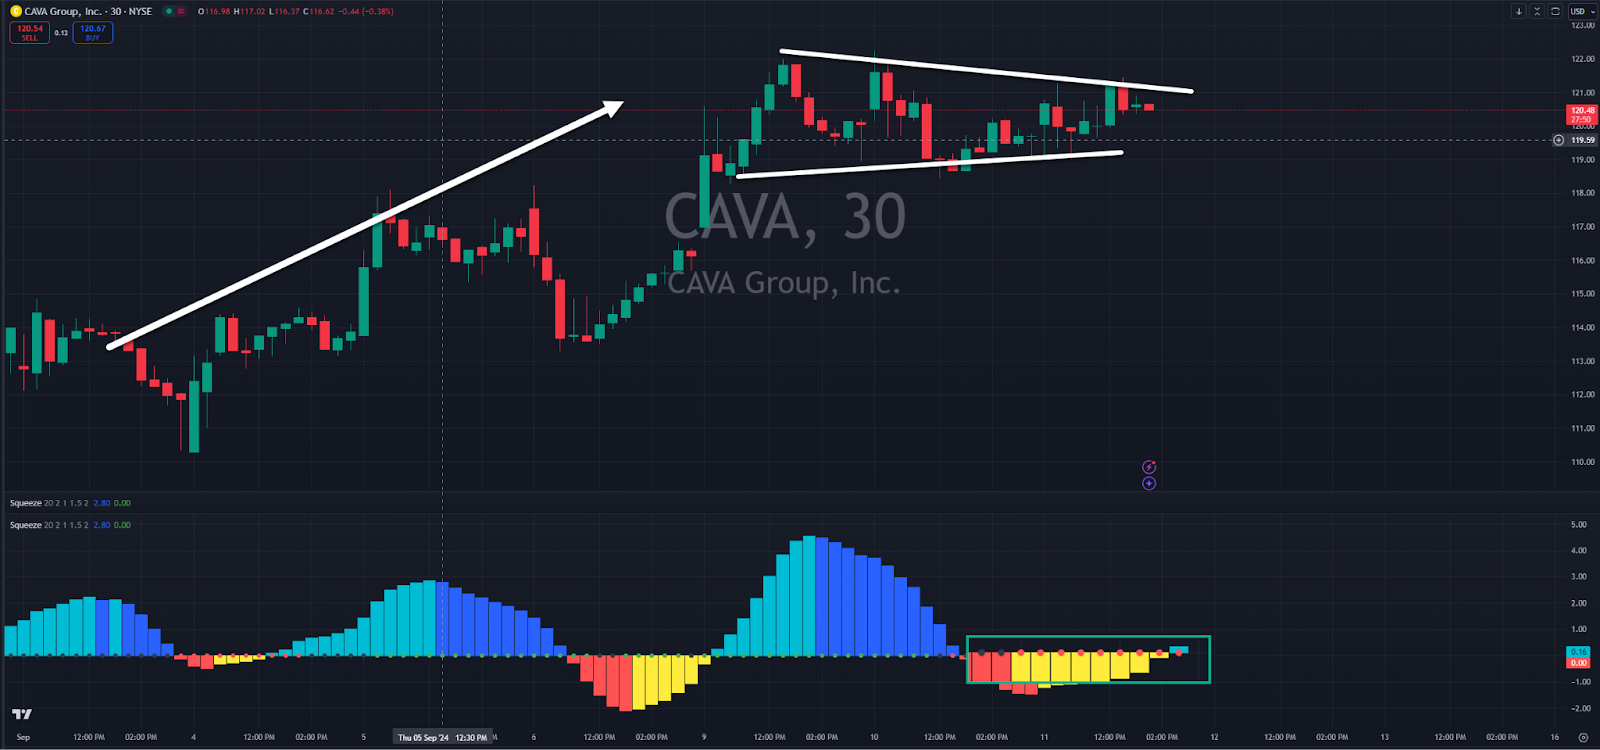
Here, we have a stock that’s in a strong uptrend with a nice consolidation pattern and a squeeze (as shown at the bottom with the red dots), indicating a breakout should be imminent.
Since this stock wasn’t falling with the rest of the market, I had a hunch it would still get a boost if the market turned around.
Sure enough, as you can see on the time stamps below, CAVA pushed higher with the rest of the market right after the S&P 500 found a bottom.