Unmasking Dollar Tree’s Weakness: A Bearish Strategy
I’m a bullish trader by nature; buy high and sell higher.
But when markets jump as much as they did yesterday, it’s nice to balance things out with a bearish setup.
Dollar Tree (DLTR) is a stock I’ve kept my eye on ever since it reported awful earnings earlier this month.
Shares got annihilated, plunging 22% after falling 10% the week prior.
Yet, somehow the stock found support at $64 a share and has been trending upward ever since.
So, why am I willing to step in front of this dead cat bounce?
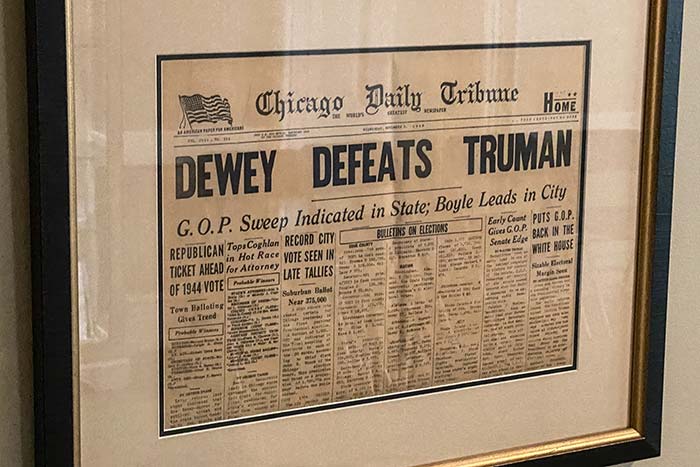
For starters, it was one of the few stocks down on Thursday when everything else was ripping. In my eyes, this is a sign of relative weakness.
Second, the stock formed bearish shelves on two different timeframes.
Since you may not be familiar with a bearish shelf, let me explain what I’m talking about.
A bearish shelf is basically a bearish TPS setup with a tightening range.
It forms from a downward thrust that moves into a narrowing chart pattern.
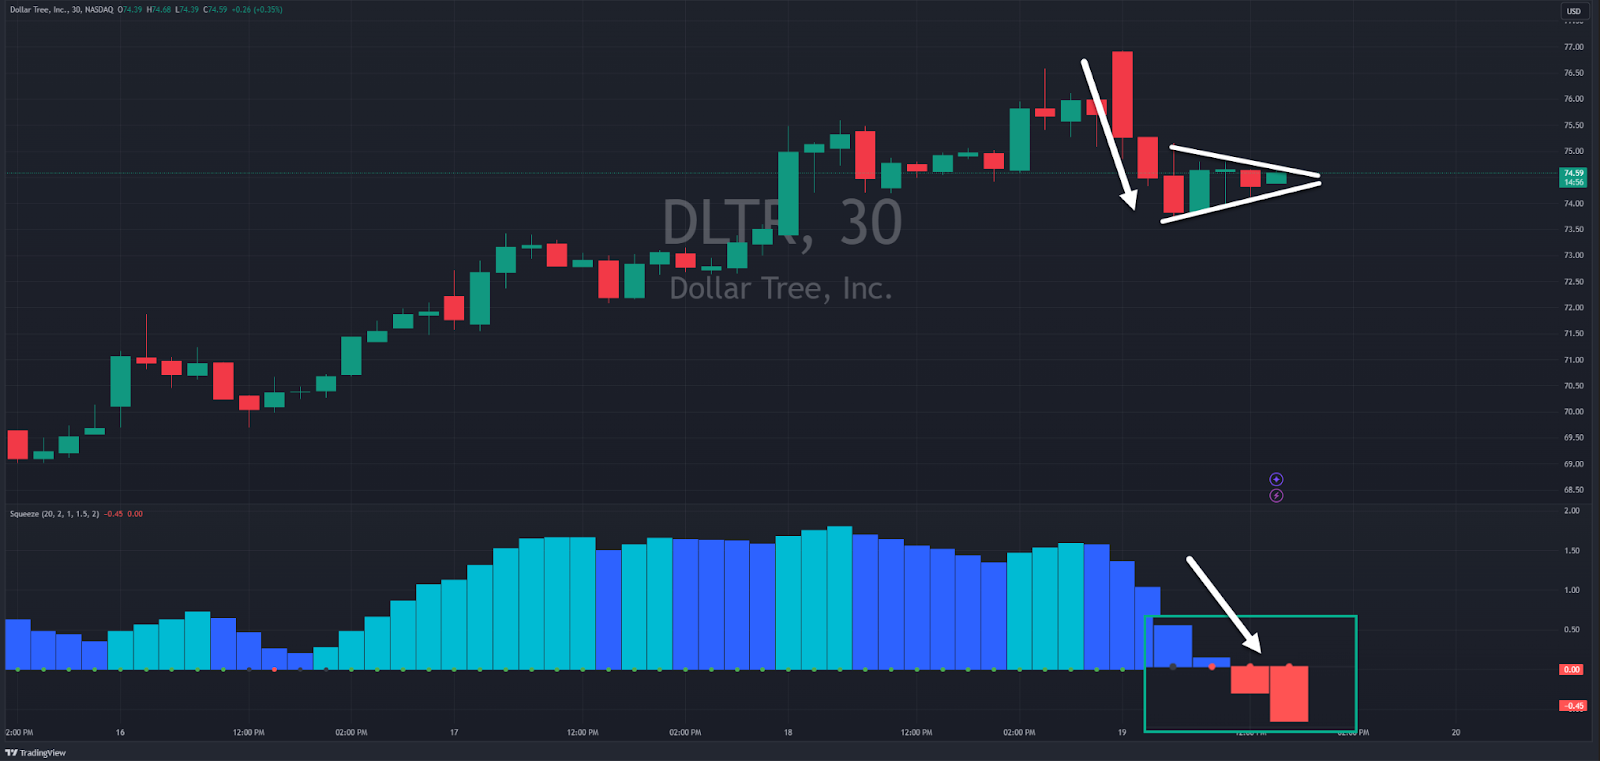
This 30-minute chart illustrates what it looked like for Dollar Tree.
Now, you might be asking yourself, why isn’t this a bullish pattern? After all, the stock was clearly in an uptrend.
Here’s my thinking.
This stock opened at new (recent) highs. It then fell and started closing candles and consolidating below the bottom end of the previous bullish pattern.
Had price managed to stay above $74.50 or so, then I might not have chosen to take a bearish trade here.
On top of that, the momentum is very negative, as you can see in the histogram at the bottom.
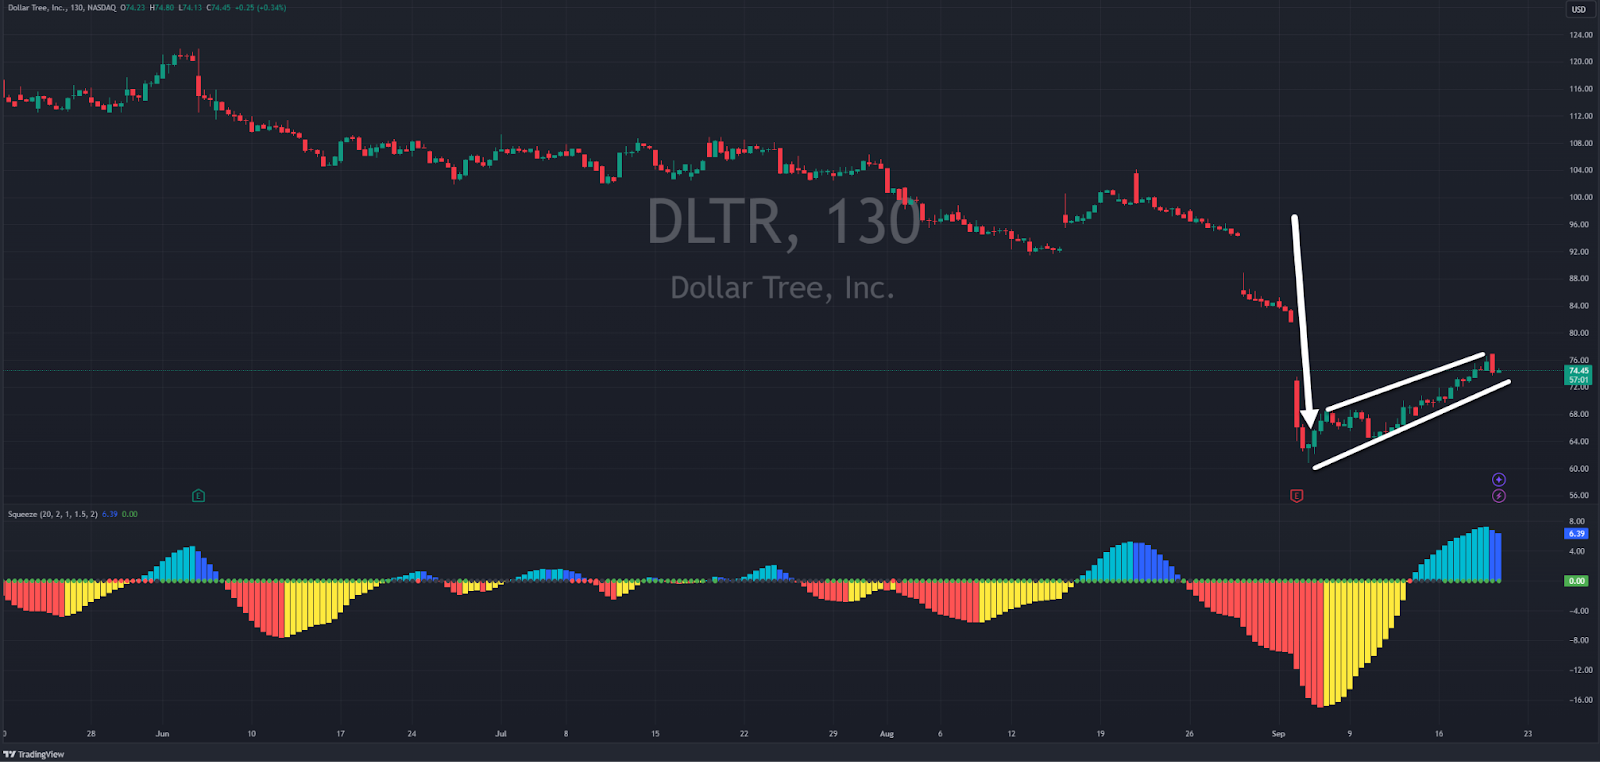
Now, I want to zoom out and show you what the 130-minute chart looks like.