Choppy markets make finding strong stocks easy
After Tuesday’s monster sell-off in equities, yesterday’s price action was flat as week-old soda.
However, day’s like yesterday offer a great opportunity.
You see, when the market is super strong or super weak stocks for the most part tend to move in the same direction.
But when it’s chopping around, it allows you to find stocks that are relatively strong or weak rather easily.
One of those stocks that outperformed the market in a big way is my top watchlist idea for today.
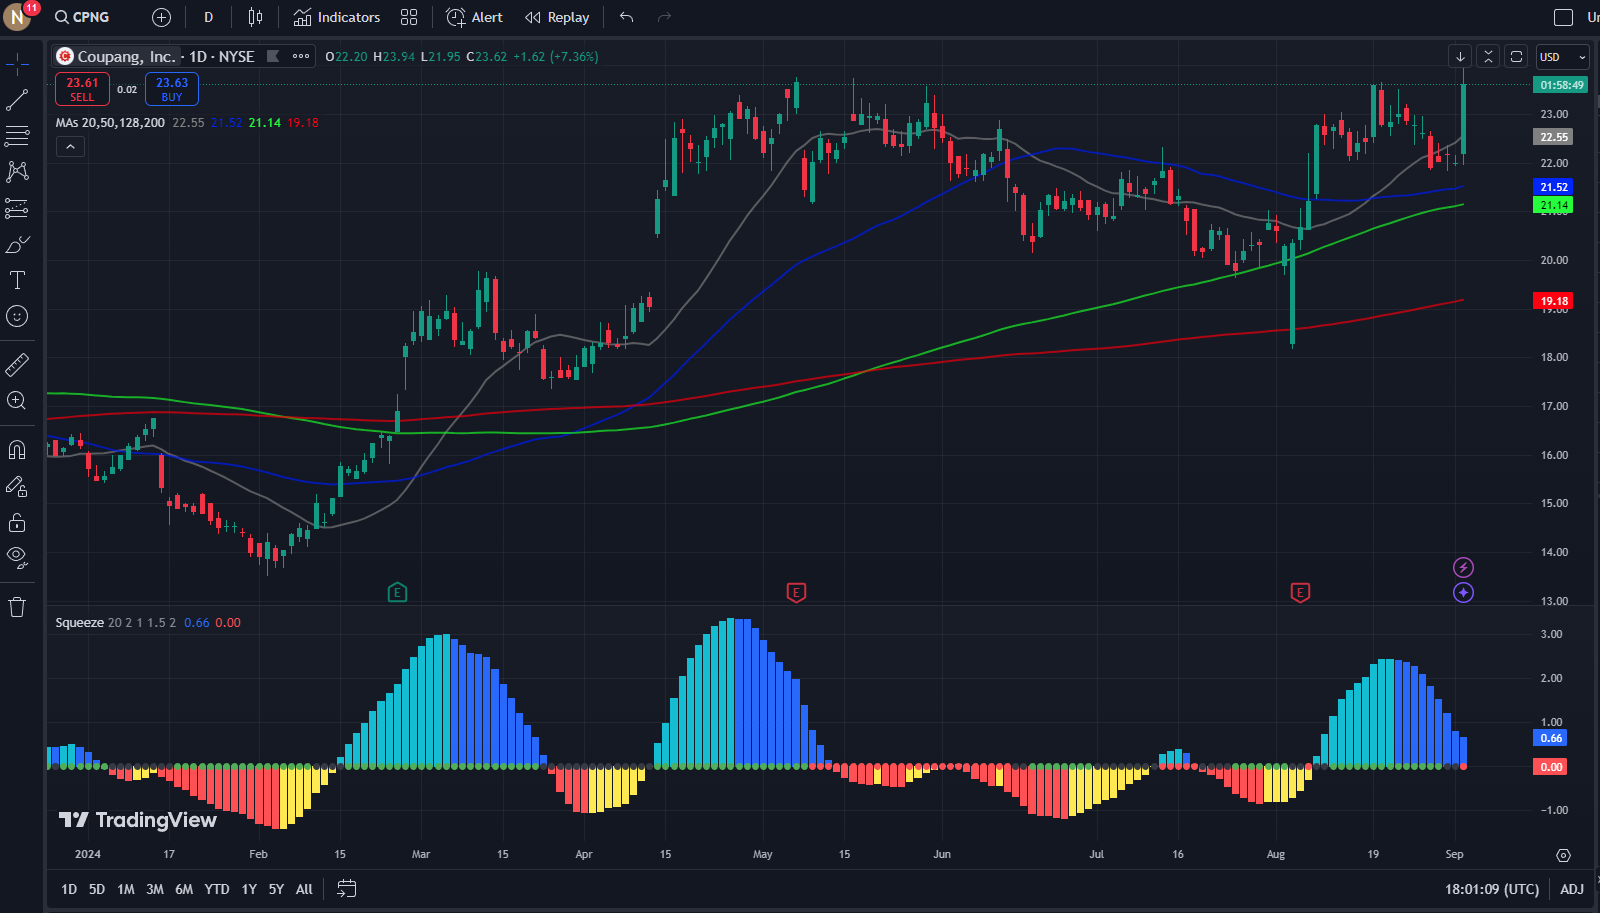
I’m talking about Coupang (CPNG), which surged more than 8% while the broader market barely budged.
For those unfamiliar, Coupang is a South Korean e-commerce powerhouse. They operate an online marketplace offering everything from electronics to groceries, and they’re known for their lightning-fast delivery service.
Think of them as South Korea’s answer to Amazon, but with a focus on same-day or next-day delivery through their extensive logistics network.
Now, let’s talk about what got Wall Street’s attention. CLSA analyst Brian Lee just upgraded Coupang to Outperform from Hold, slapping a juicy $31 price target on it.
That’s a massive jump from the previous $18 target. Lee’s crystal ball shows Coupang’s sales growing at a 17% clip annually for the next five years.
He’s betting on industry growth and market share gains as the e-commerce landscape in South Korea consolidates.
Lee expects Coupang’s operating margin to more than double, from 1.9% in 2023 to over 5% in 2027.
In his words, Coupang is becoming the “last man standing” in the Korean e-commerce arena, potentially gobbling up a 35% market share by 2028.
To be clear, I would never take a position based on what an analyst says or on a news headline. The majority of my trading decisions are based on price action and setups.
I want to be aware of catalysts, but make my entries and exits based on what I see in the charts.
This catalyst, combined with the stock’s technical strength, is why Coupang just landed on my watchlist.
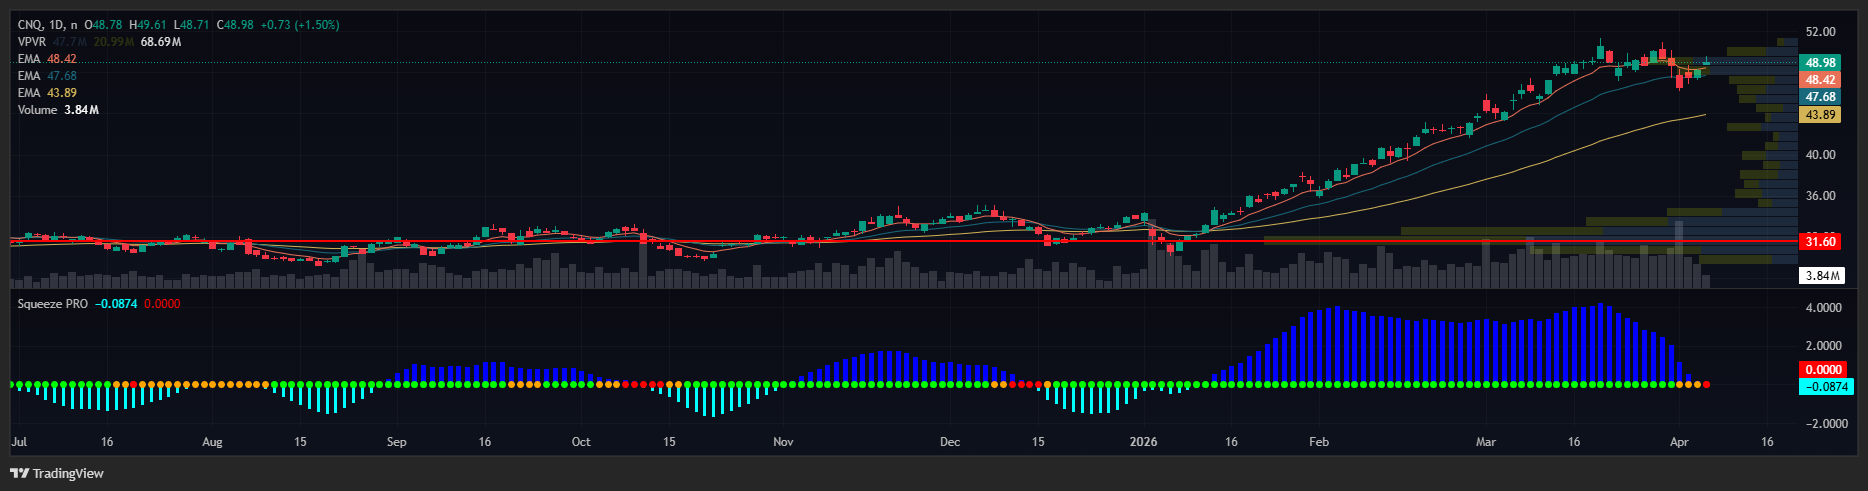
Here’s what caught my eye from a technical standpoint:
Fresh Daily Squeeze:
A “squeeze” is a period of low volatility where the Bollinger Bands contract and move inside the Keltner Channels. This compression often precedes a significant price movement.
When we say there’s a “Fresh Daily Squeeze,” it means this pattern has just appeared on the daily chart.
During a squeeze, the stock is essentially coiling up like a spring. The longer the squeeze lasts, the more potential energy builds up.
When the squeeze “fires” or releases, it often results in a strong price move in either direction. Traders watch for the direction of the initial move to determine whether to go long or short.
Stacked Daily EMAs (Exponential Moving Averages):
EMAs are trend-following indicators that give more weight to recent price data. When we say the EMAs are “stacked,” we’re typically looking at multiple EMAs of different lengths (e.g., 8-day, 21-day, 50-day, 200-day).
In a bullish stacked configuration, you’ll see the shorter-term EMAs above the longer-term ones, with price above all of them.
For example: Price > 8 EMA > 21 EMA > 50 EMA > 200 EMA
This arrangement suggests that the recent price action is stronger than the longer-term trend, indicating strong upward momentum across multiple timeframes.
Breaking 52-Week Highs:
When a stock breaks above its 52-week high, it means it’s trading at a price not seen in the past year. This is significant for several reasons:
a) Psychological impact: It can attract more buyers who see the stock making new highs.
b) No overhead resistance: Anyone who bought the stock in the past year is now in profit, reducing potential selling pressure from those looking to “break even.”
c) Momentum indicator: Stocks making new highs often continue to do so, as per the momentum principle in technical analysis.
Relative Strength:
Relative strength compares a stock’s performance to a benchmark (usually the overall market) over a specific period.
When a stock shows relative strength, it’s outperforming the broader market.
In this case, while the overall market was flat, CPNG rose by 8%. This outperformance is notable because:
a) It suggests that buyers are specifically interested in CPNG, not just riding a broader market trend.
b) It indicates that CPNG might be resistant to market downturns.
c) Stocks that outperform in flat or down markets often lead the charge when the market turns bullish.
This relative strength is particularly impressive in a flat market, as it suggests that investors are rotating into CPNG from other stocks.
Your Action Plan:
While I haven’t taken a position in CPNG, it’s definitely on my watchlist. Here’s what I’m looking at and what you might consider:
- Watch for Continuation: After breaking out, stocks often continue their trend. I’ll be watching to see if CPNG can hold above its previous 52-week high.
- Monitor Volume: Increased trading volume can confirm the strength of the breakout.
And if I do move on this, you can find this trade in my Daily Profits Live Room.
P.S. Speaking of the Daily Profits Live Room, I’m opening the doors up for everyone!
That’s right…
On September 9 to 13, I’m having a FREE OPEN HOUSE.
If you’re reading this, you’re on my special invite list.
All you have to do to secure your spot is click here and register.
Last time I held one of these, I nailed a 1,129% winner in the ticker symbol RILY in 48 hours.
Now, I can’t promise those types of fireworks again. But with market volatility picking up, I wouldn’t be surprised if we find something juicy to trade.
So if you want to trade alongside me for a FULL WEEK at absolutely zero cost to you.