A Bullish Pattern on This EV Stock
After a big rally in November, the indexes are overbought.
Will we see a pullback soon? Maybe. Maybe not.
But until we do, there’s no reason to short the market.
However, there’s a chart with a nice bull pattern that I’m looking to get positioned in today.
Click the image below to get the trade.
![]()
YOUR ACTION PLAN
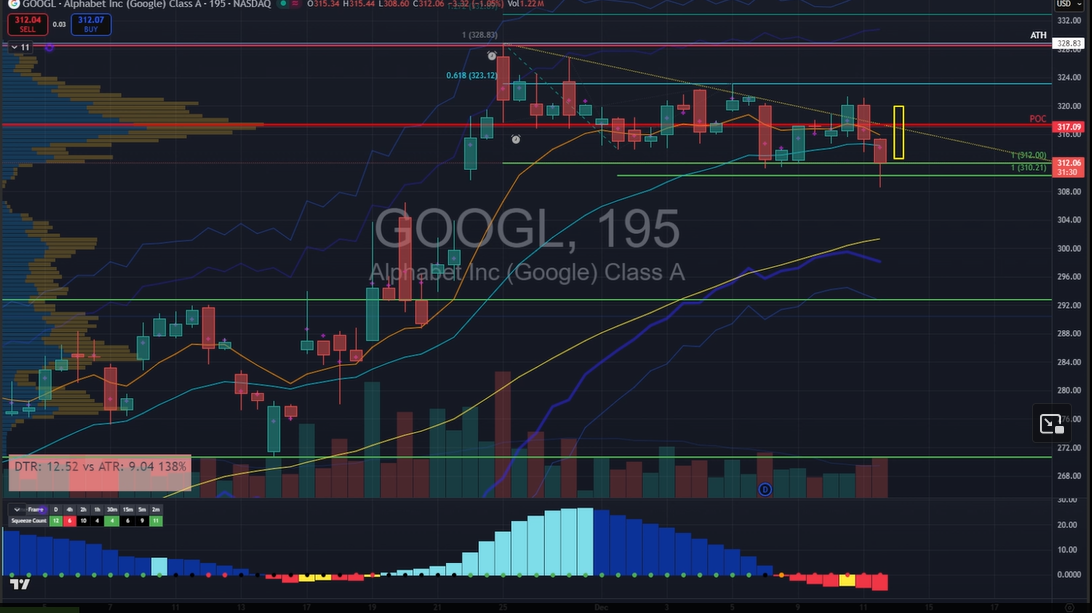
As you’ll see in the chart below, Tesla (Nasdaq: TSLA) has a bull pennant on the 130-minute chart, and I’m looking for the stock to move higher and break out of this pattern. Right now, I’m looking to buy the December 8 $240 calls when TSLA is trading at around $232 to $235. My price target will be around $240, and I’ll stop on a daily close under $230.
To get more trades like this one, follow along with me in Daily Profits Live. Last week I closed a 32% winner on Coinbase (COIN) in less than one trading day, and I’m on a mission to turn a $37,000 account into $1 million in verified trading profits.
Click here to learn the secrets of how I went from a construction worker to a full-time day trader.
P.S. I love answering your questions. It’s the best and most rewarding part of my gig. If you have a ticker or chart you want me to break down – or just a general trading question – please email me at feedback@monumenttradersalliance.com. I’ll let you know my thoughts on a few submissions in a future video.
TESTIMONIAL TUESDAY
“In [WME] at $2.53 out $3.10, 22% [in less than one trading day]. Feels great thanks BB.”
– Jack M
“SPX in at $1.37 and out at $5.00 [264% gain in less than one trading day] Thanks NATE!!!!”
– JoeS
“I closed the 1 Shares/Contracts I opened at $102.34 for $61.66. +40% in 3 weeks, thanks Karim! Trade was closed 11-09-23 with CARR. $51.18/share.”
– Brad S-43

 (Click to enlarge)


