How One Graduate Class Changed Everything I Know About Market Behavior
Have you ever taken a class where it felt like the professor opened up your brain like an empty Tupperware container and filled it with knowledge?
That’s what happened to me when I took a graduate-level class with one of my mentors in technical analysis, Dr. Hank Pruden.
For those unfamiliar with technical analysis, it’s analyzing markets using charts. I was expecting to learn about trend lines, bullish and bearish patterns, cycle analysis – the usual stuff.
Instead, we dove deep into the psychology of markets, trying to understand what motivates investors and traders to act the way they do.
Today, many institutions teach behavioral finance, but at the time, it was groundbreaking stuff.
The most important concept? Investors’ behavior repeats itself time and time again. There are no guarantees, and every situation will be different, but humans can be fairly predictable.
We typically fear the worst just before things get better… and we expect things will always be this good just before they get worse.
This course taught me key ideas I still use nearly three decades later. Here are the most impactful ones.
Overconfidence
I’d bet almost everyone reading this believes they’re a better-than-average driver.
In college, I had an argument with a friend about what a horrible driver he was. “How many cars have you totaled?” I asked. (The number was three in the previous four years.) “Yeah, but they were all somebody else’s fault!” he exclaimed.
Enough said.
When things are going well in the markets, investors often confuse a bull market with their own genius and think they’ll know when to get out. Of course, it doesn’t work out that way.
Confirmation Bias
Confirmation bias occurs when you focus only on information that confirms your beliefs. People do this with politics all the time, and the media feeds it by giving them information that aligns with their point of view.
In markets, an investor may believe a stock is a great buy because they see the company’s products everywhere… which causes them to ignore the fact that the stock has been in a downtrend all year. Despite the market signaling things aren’t great, the investor buys anyway.
The Herd Effect
How many times have you walked past an empty restaurant to wait at a crowded one?
We’ve seen this repeatedly in investing – dot-com stocks, crypto, cannabis stocks, meme stocks – because that’s what everyone else was doing.
How to Use This Knowledge
Being aware of these concepts helps you question your own decision-making and think critically about each buy and sell.
You can also use stock charts to test your opinion.
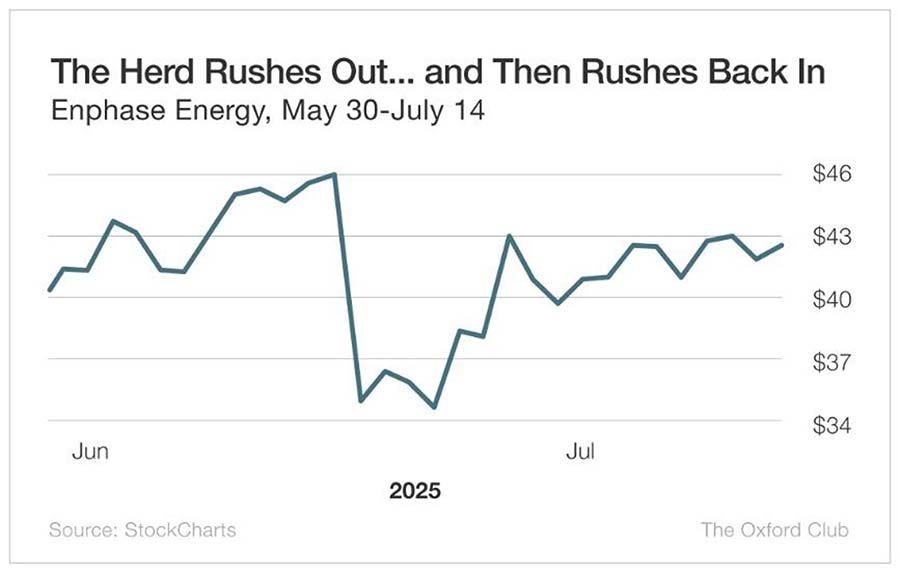
For example, earlier this year, Enphase Energy (Nasdaq: ENPH) fell off a cliff, dropping 24% in one day over concerns about clean-energy tax credit removal.
Keep in mind, this wasn’t a sketchy startup with zero sales. Enphase is a viable, well-established company. It made no sense that everyone was bailing.
Let’s say you were on Reddit reading about Enphase and all the reasons the stock was toast. One look at the stock chart would’ve told you “the herd” was likely overreacting.
Here’s what to look for: When a quality stock gets hammered on news but finds a floor and stops falling, it’s likely going to reverse quickly. The chart shows you when the panic selling exhausts itself.
Sure enough, Enphase was up 5.2% the next day and rose more than 19% in less than a month.
![]()
YOUR ACTION PLAN
Technical analysis is simply the visual representation of investors’ emotions. The more aware you are of those emotions and behaviors – and how to interpret them on charts – the better trader and investor you’ll be.
That Tupperware container Dr. Pruden filled three decades ago? It’s still helping me spot these patterns today.
Good investing,
Marc
More from Trade of the Day
Great Stocks On Down Days = Buckets Of Cash
Mar 11, 2026