From Tariff Hoarding to Chart Collapse: Why Best Buy’s About to Fall 15%
More than 20 years ago, during a rained-out vacation in Naples, Florida, I gave each of my three kids $20 to spend at the local mall.
We roamed through the mall checking out each store, but the moods shifted immediately when the kids saw a Pac-Sun Store.
Everyone rushed into the store ripping through shelves and racks as they tried to figure out what to buy. Get this, they actually pooled their money in the Pac-Sun store to stretch their buying power!
Something powerful was going on, and it meant that there was an opportunity for me.
Three days later, I bought Pac-Sun stock. It ended up as one of my best-performing positions that year.
That experience shaped how I invest. I don’t wait for analysts to bless an idea. I watch behavior – mine, yours, and the people around us.
The best investment ideas are often right in front of you, not behind some paywall on Wall Street.
CJ’s Walk Down Main Street: December 6, 2025
This season, I hit the streets looking for the “perfect” gifts.
Living downtown in Cincinnati, I try to support local businesses – but like everyone else, I end up at a strip mall: DSW Shoes (DBI), Ulta (ULTA), REI, and of course… Best Buy (BBY).
Inside Best Buy? Empty. Music playing, video games running, but very few shoppers. I asked the cashier while I was checking out what was going on with the empty store. Her response? “We’ve been slow all season.”
That’s all I needed to hear. Best Buy – once a seasonal winner – is struggling. Opportunity knocking.
The Consumer is Slowing
Electronics prices aren’t the problem.
CPI data shows TVs and similar items are down about 2% year-over-year. The issue is demand and timing.
Earlier this year, consumers hoarded big-ticket items to front-run expected tariff hikes.
That “tariff hoarding” showed up clearly in March data and persisted through summer, lowering demand heading into the holidays. It helped Best Buy to blow buy its early summer earnings expectations, but things are catching up now.
Now, analysts at Telsey Advisory Group expect prices to rise in late December and January as retailers pass along tariff costs. The result: Things are about to go from slow to dead.
The Real Pressure: Heating and Grocery Costs
Karim just mentioned it on the weekly Catalyst Cash-Outs Live on Tuesday, what used to be a sub $100 trip to the grocery has turned into a $300+ trip for the same provisions. Inflation at the grocery store hits every American, not a single class.
TV prices may be flat, but inflation is hitting consumers elsewhere. Now, add in heating costs for the winter…
EIA data shows:
- Electricity: +10%
- Natural Gas: +8–9%
- Overall heating costs: +7–8% from last winter
- Regions hit hardest: Northeast and Midwest
That squeeze is hitting everyone, fast.
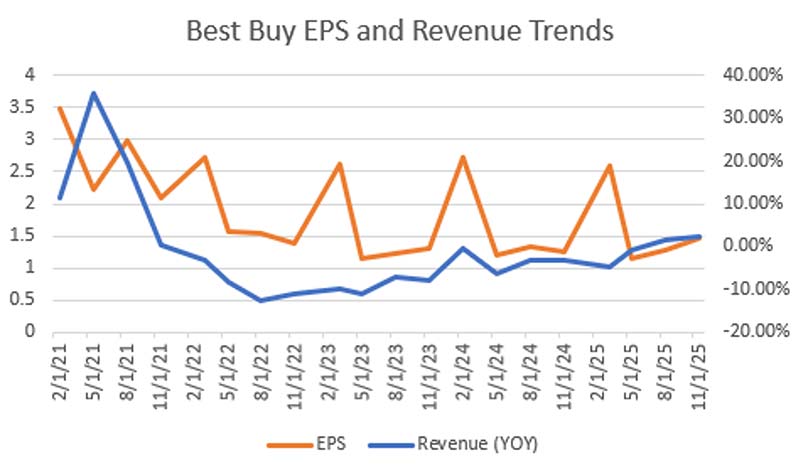
Best Buy Already Showed Its Hand
Best Buy had a brief stretch of strength earlier this year, possibly fueled by that tariff hoarding. But revenue and earnings have remained weak.
Year-over-year revenue growth just turned positive at +2%, after posting a -10% decline during the last slowdown.
Meanwhile, Amazon, Walmart, and Costco now outsell Best Buy in televisions. The company’s moat is gone.
Best Buy’s Seasonal Tailwind Is Over
Retailers historically thrive in the stretch between Labor Day and Black Friday.
Best Buy didn’t miss the trend this year as shares jumped over 30% during the seasonal rally, outperforming both the S&P 500 (+9.8%) and the SPDR S&P Retail ETF (+0.02%).
But that seasonal strength is now a headwind. December is historically one of Best Buy’s weakest months:
- Average December return: –2%
- Only 5 positive Decembers in the last 20 years
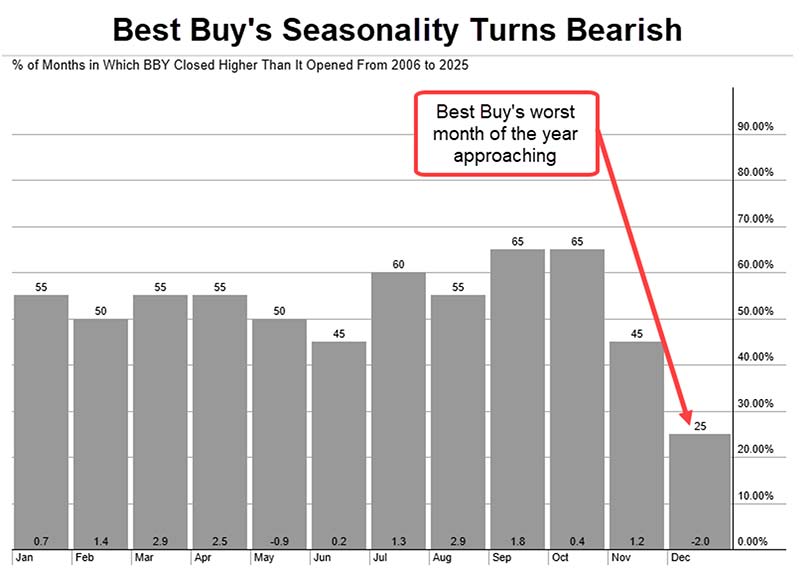
That’s not a dip, that’s a trend. I always tell my followers Don’t Fight the Trend!
Best Buy’s Chart: A Breakdown in Motion
Following a mediocre rally, Best Buy’s chart is flashing multiple bearish signals:
- 50-day moving average is rolling over into a bearish trend. Last time this happened? March 2025 – right before a 22% decline.
- Post-earnings rally has fully reversed, with the stock falling back below its 50-day.
- 20-day moving average (my Trader’s Trendline) just crossed below the 50-day, confirming a momentum shift.
- Critical support at $72.50 is about to break – this line has held four times in three months. Add in the nearby 200-day moving average, and this is a double breakdown setup.
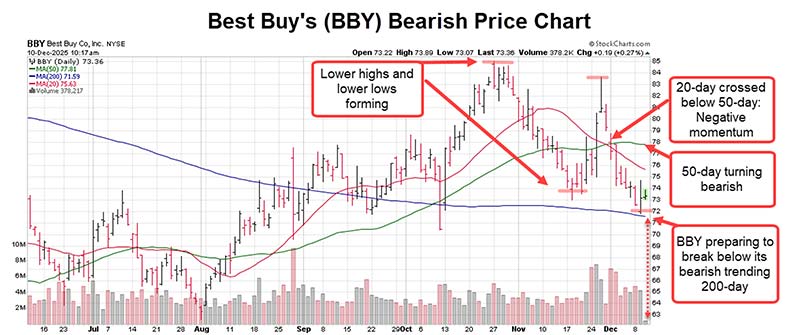
If this level fails, BBY is headed toward $62.55, a 15% drop from its current price and tradable opportunity.
How to Trade the Breakdown
If you’re long on Best Buy, reconsider the hold.
The break below $72.50 – especially with the 200-day sitting there – is likely to trigger high-volume selling and increased volatility as investors run for the doors.
Here’s My Trade Idea…
- Buy-to-Open: BBY March 20, 2026 $75 Put
- Target entry price: $6.50 (based on Black-Scholes model, not current market price)
- Target price for BBY: $62.50
- Potential return: $12.50 value at expiration = ~92% profit
Exit Strategy:
- Profit target: Close if return exceeds 100%. Don’t get greedy!
- Technical stop: I strongly consider closing the put if BBY closes above its 20-day moving average for three straight days.
![]()
YOUR ACTION PLAN
Options involve significant risk and aren’t suitable for all investors. They can be highly volatile, and you may lose 100% of your premium quickly.
Before trading, review the Characteristics and Risks of Standardized Options, understand assignment/exercise mechanics, and ensure any position size fits your risk tolerance and time horizon.
I recently recorded a new video on why traders make decisions in 0.3 seconds and how to avoid “analysis paralysis.”
More from Trade of the Day

Great Stocks On Down Days = Buckets Of Cash
Mar 11, 2026