How I Find Months of Potential Winners – With ONE Stock
The latest earnings season just kicked off and will run through the end of November.
We’ve already seen big surprises from companies like Tesla, ServiceNow, and Celestica.
For traders, this is a lucrative time of the year.
Earnings day can be a big momentum shifter for a stock.
But the truth is…
It’s just the start of many, many profit opportunities.
In fact, there’s a post-earnings chart pattern I’ve been using for more than a year that’s so potentially lucrative I’m calling it the “Earnings Profit Surge.”
This surge occurs after a company reports an earnings beat, and it results in steady gains for the stock over and over again… sometimes for more than two months!
I explain it all – with visual examples – below.
How to Identify the “Earnings Profit Surge” Chart Pattern
Let me show you an example of what an Earnings Profit Surge looks like. Take a look at the chart of artificial intelligence stock Nvidia (NVDA).

Notice the earnings gap in the chart. That happened on the day the company reported earnings.
Then the stock was bullish after earnings day – as you can clearly see by the uptick in price.
Now, here’s where it gets interesting.
You’ll notice the stock continued to go up after the earnings announcement. This rise is what I call the Earnings Profit Surge.
And the two vertical lines show when I’d typically get positioned in the trade based on the three “green light” variables in my TPS system.
Also, notice how the stock goes up, then pulls back, and then goes up again.
This pattern repeats itself all the way through April to the beginning of May…
Meaning there were 30-plus days of consistent positive momentum for this ONE STOCK.
So in theory, you could’ve traded this ONE TICKER over and over again – based on this pattern alone – for consistent gains.
Here’s another example – this one’s in Microsoft (MSFT).

Notice the similarities to the NVDA chart…
Again, you have the earnings gap, the trading window and the Earnings Profit Surge.
Let’s take a look at one more example: Gilead Sciences (GILD).

Again, we see a major boost after earnings… and then a steady wave of gains and pullbacks.
Once you learn how to identify this pattern, you won’t be stuck trying to trade on earnings day. There’s still plenty of opportunity to profit for months afterward.
In short, earnings day isn’t the be-all, end-all for potential gains… It’s actually just the start.
Here are a few reasons I love the idea of trading the Earnings Profit Surge:
- It gives you several opportunities to trade after earnings come out. More opportunities mean more potential wins.
- While it’s common to trade on earnings, the truth is you don’t always know which direction a stock will go. So you end up betting on whether the stock will go up or down, which is really no different from gambling.
- By following the Earnings Profit Surge, you’re trading with the consistent momentum generated by earnings news. It’s a simpler, more predictable way to trade.
![]()
YOUR ACTION PLAN
My Earnings Profit Surge discovery has the potential to create simple, consistent winning trades on just ONE TICKER. And it’s the focus of my service Profit Surge Trader.
Every month, I zero in on a single ticker… and then, every Monday at noon ET during a special livestream, I’ll come up with our exact game plan for our weekly trade.
The goal is to make as much cash as possible from one ticker.
And then, at the end of the month, we’ll restart the process with a brand-new ticker.
This is the easiest – and potentially the most lucrative – form of trading I’ve ever used, and I’m inviting you along for the ride.
My next Profit Surge move is this Monday.
Click here to unlock that trade.
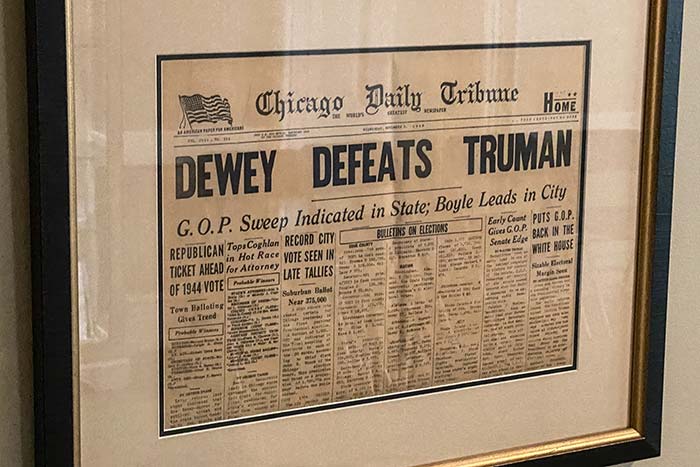
FUN FACT FRIDAY
Market historically volatile if incumbent party loses: With the election two weeks away, here’s one fact that stands out. When the incumbent party failed to remain in the White House, the S&P 500, on average, experienced higher levels of volatility after the elections. This reflects the uncertainty created by a new administration and its policy changes.