“In uncertain markets, follow the relative strength. GDXJ’s daily squeeze and multi-timeframe EMA alignment create ideal conditions for a potential breakout move.”
Volatility continues to dominate headlines as traders grapple with uncertainty in the global economy.
Between inflation concerns, shifting monetary policies, and ongoing sector rotations, the broader market has struggled for direction.
While such an environment can be challenging, it also creates opportunities for traders who focus on individual setups.
One standout right now is GDXJ—the VanEck Junior Gold Miners ETF.
GDXJ has been a leader this year, up nearly 20% year-to-date, and is trading just below its 52-week high of $55.58.
Its technical setup is particularly compelling: a daily squeeze pattern, perfectly stacked EMAs on both daily and weekly charts, and exceptional relative strength.
In a market searching for stability, GDXJ offers a rare combination of bullish technicals and strong fundamentals.
What Is GDXJ, and Why Does It Matter?
The VanEck Junior Gold Miners ETF (GDXJ) is designed to provide exposure to smaller gold mining companies. Unlike its larger counterpart, GDX, which focuses on major miners, GDXJ invests in junior miners—companies that are typically earlier in their growth cycles and more leveraged to gold price movements.
This leverage makes GDXJ especially attractive during times of rising gold prices. Junior miners tend to see amplified gains compared to larger miners because their costs are relatively fixed, meaning any increase in gold prices has an outsized impact on their profitability.
In today’s uncertain environment, gold has emerged as a safe-haven asset, benefiting both the metal itself and the miners who produce it.
With inflation concerns and potential market headwinds, GDXJ is positioned as a strong option for traders looking to capitalize on the strength of the precious metals sector.
Why This GDXJ Setup Stands Out
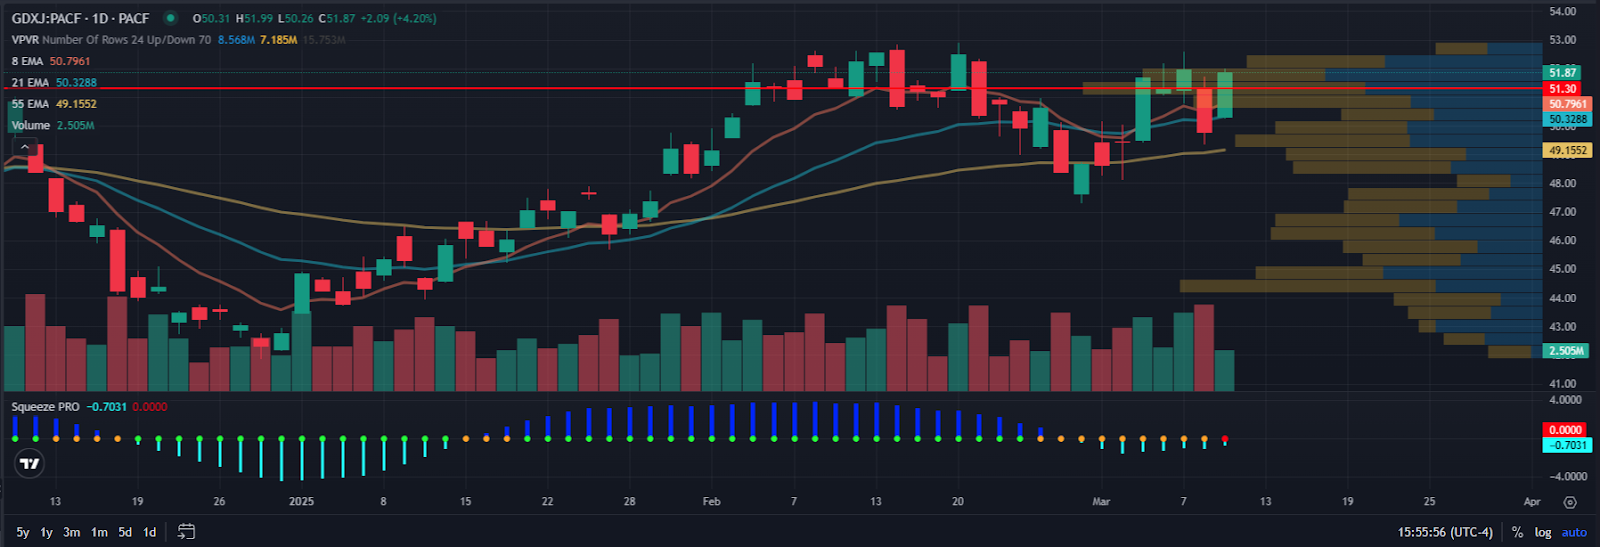
The Daily Squeeze: A Prelude to Big Moves
A daily squeeze is one of the most reliable technical signals, and GDXJ is currently displaying this pattern just below its 52-week high.
A squeeze forms when Bollinger Bands (which measure volatility) contract inside Keltner Channels (which measure average true range). This compression indicates that the market is in a period of low volatility, like a coiled spring preparing for a release.
When the squeeze “fires,” it often results in a strong directional move. In GDXJ’s case, the proximity to its 52-week high suggests that a breakout to the upside is the most likely scenario.
What makes this squeeze particularly compelling is the context: GDXJ has been consolidating near its highs while maintaining excellent technical structure.
This type of setup often leads to explosive moves as market participants rush to catch the breakout.
Stacked EMAs: A Sign of Strong Momentum
One of the most bullish technical signals a trader can see is stacked Exponential Moving Averages (EMAs). In GDXJ’s case, the daily EMAs (8, 21, 34, 55) are perfectly aligned, with shorter time frames above longer ones—a clear indication of strong and sustained momentum.
Stacked EMAs create a “bullish ladder,” where each moving average acts as a support level during pullbacks.
This alignment is a sign of institutional buying, as large players tend to build positions in stocks with strong trends and clear support levels.
Even more encouraging is the fact that GDXJ’s weekly chart also shows stacked EMAs, reinforcing the strength of the uptrend across multiple timeframes.
This kind of alignment is rare and underscores the ETF’s potential for further upside.
Relative Strength: Outperforming the Market
While many sectors have struggled this year, GDXJ has been a clear leader, up nearly 20% year-to-date.
This level of relative strength is critical in volatile markets because it highlights where institutional money is flowing.
Relative strength isn’t just about performance—it’s about resilience. GDXJ has held up remarkably well even as broader market conditions have deteriorated, signaling strong demand and investor confidence in the precious metals sector.
In times like these, identifying market leaders is essential. GDXJ’s ability to outperform in a challenging environment makes it a standout opportunity.
Sector Tailwinds: Why GDXJ Is Poised to Do Well
The fundamental backdrop for GDXJ is as strong as its technical setup.
- Rising Gold Prices: Gold has been one of the best-performing assets this year, benefiting from its role as a hedge against both inflation and economic uncertainty.
- Weaker Dollar: A declining U.S. dollar boosts gold prices, providing a direct tailwind for mining companies.
- Falling Input Costs: With oil prices retreating, miners’ operational costs are decreasing, further enhancing their profit margins.
- Sector Rotation: As traders rotate out of overextended sectors like technology, money is flowing into commodities and precious metals, creating additional demand for ETFs like GDXJ.
This combination of technical strength and favorable fundamentals makes GDXJ one of the most attractive setups in today’s market.
Your Action Plan
I don’t currently have a position in GDXJ, but it’s firmly on my watchlist. The combination of a daily squeeze, stacked EMAs across multiple timeframes, and relative strength makes this a high-probability setup worth tracking.
If the daily squeeze “fires” to the upside, we could see GDXJ break out and continue its strong year-to-date performance.
This kind of technical alignment—where bullish patterns and sector strength converge—is exactly the type of setup that can lead to explosive moves.
And while GDXJ is an exciting candidate right now, there’s an even more powerful strategy I’ve been using to target massive gains just minutes after the market opens.
If you’re ready to go after trades with the potential for 100%, 200%, or even 300%+ returns within minutes of the opening bell, you need to check out my Opening Bell Aftershocks strategy.
Click here to discover how to start trading Opening Bell Aftershocks now.