Six Months of Chop. One Stock That Did Not Care.
The S&P 500 has gone nowhere for six months.
Six months of chop. Six months of headlines, reversals, and noise that added up to almost nothing. And now, to start 2026, it is down about 6% on top of that.
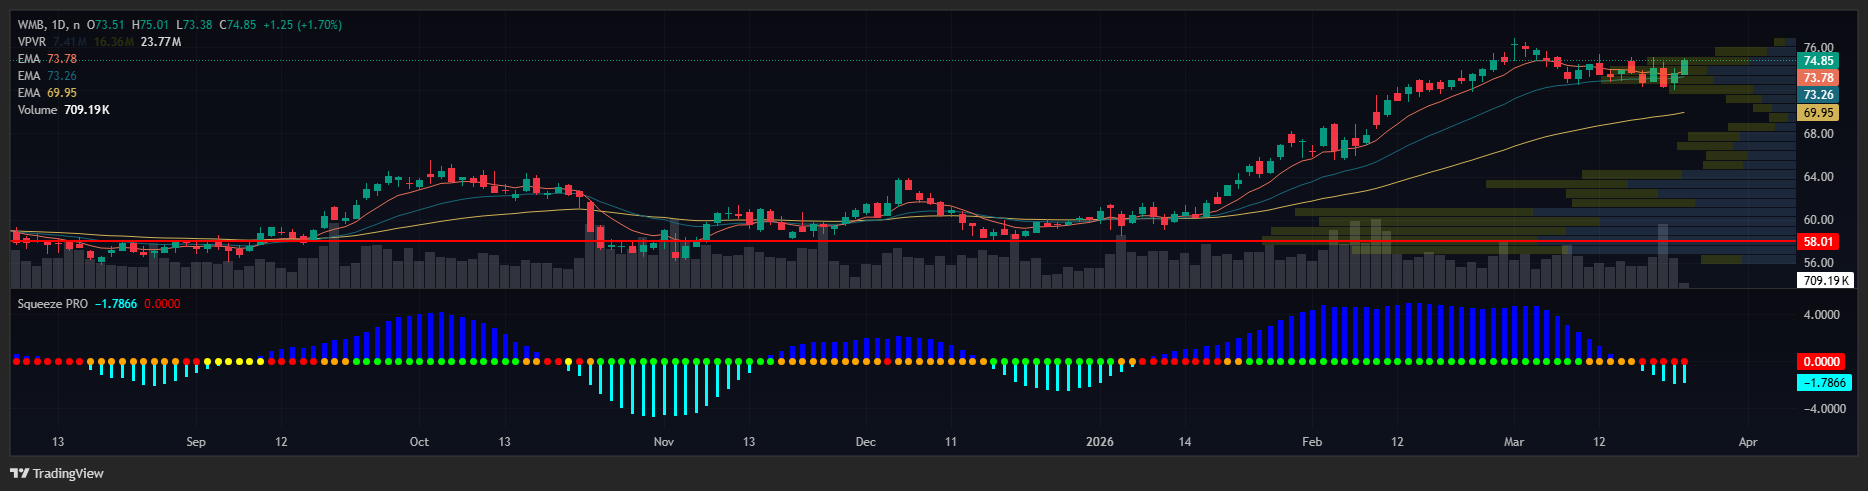
WMB is up 22% year to date.
That is not luck. That is a stock telling you exactly where real institutional money is moving while everyone else is treading water. When I see that kind of relative strength in a market going nowhere, I stop everything and pay attention.
After blowing up twice and rebuilding, I stopped trying to predict the market. I built a repeatable system and learned to wait for it. That discipline turned $37,000 into $2.7 million. Right now the system is pointing at Williams Companies. Ticker WMB.
The Business Behind the Chart
Williams Companies moves about one-third of all natural gas consumed in the United States through its Transco pipeline system. It does not produce gas. It moves it.
The company operates on long-term fee-based contracts, meaning customers pay for pipeline capacity whether they use it or not. That structure largely insulates the business from commodity price swings.
The most recent earnings report, covering Q4 and full year 2025, showed record adjusted EBITDA of $7.75 billion, up 9% year over year. Net income rose 18%. Earnings per share came in at $2.10, up 9% from the prior year.
The company raised its dividend for the 52nd consecutive year and guided 2026 EBITDA to a midpoint of $8.2 billion.
Here is what changes the growth trajectory entirely. Williams has committed $5 billion to power projects serving AI data centers directly, including facilities tied to Meta, OpenAI, and xAI. The company is positioning itself as the natural gas backbone for the AI buildout, with projects coming online under ten-year contracts starting in late 2026.
This business was already compounding before the AI tailwind arrived. Now it has both.
What the Chart Is Telling Me
Relative strength first. When a stock outperforms a weak or declining market, it signals that real institutional money is stepping in with conviction. Not traders chasing momentum.
Money that has done its homework. WMB up 22% while the broader market churns sideways is exactly that signal.
Now look at the structure underneath it.
Stacked EMAs on the daily chart. EMAs, or exponential moving averages, track the average price of a stock over a set period, weighted toward recent prices.
When shorter EMAs sit above longer ones, buyers have been consistently stepping in at higher prices over time. Right now the EMA 8 is at $73.65 and the EMA 20 is at $73.29, shorter above longer, both running below current price. That is a healthy uptrend, not a news-driven spike.
WMB has the same alignment on the weekly chart. When stacked EMAs show up on two separate timeframes simultaneously, the trend is not a short-term reaction.
The 200-day SMA sits at $62.24. The 200 SMA is the long-term trend line most institutional investors use as a floor, the level where big money tends to step in and defend a position.
WMB is trading well above it. The long-term trend is not in question.
RSI is at 55.10. The Relative Strength Index measures momentum on a scale of 0 to 100.
Above 70 means overbought, extended and due for a pullback. Below 30 means oversold. At 55.10, WMB has real room to run without getting stretched.
And now there is a daily squeeze.
A squeeze happens when Bollinger Bands contract inside Keltner Channels. Bollinger Bands measure how wide or tight a stock’s price range is. Keltner Channels measure a stock’s average trading range over time.
When the bands tighten inside the channels, volatility is compressing. The stock is coiling. Building energy for a move is like a spring under pressure. It cannot stay compressed forever. When it releases, it releases hard.
The Trend. The Pattern. The Squeeze.
Trend first. Always. Stacked EMAs on the daily and the weekly. Relative strength against a market going nowhere. The 200 SMA is far below as a foundation. This stock is not fighting its trend. It is being carried by one.
Pattern second. WMB has been consolidating in a tight range while the broader market churns around it. It is not giving ground. That is not weakness. That is a stock with real buyers underneath it holding the line.
Squeeze third. Bollinger Bands are contracting inside Keltner Channels on the daily. Volatility compressed. The tape is loaded.
All three conditions are present. That is the TPS setup: Trend, Pattern, Squeeze. In that order, every time.
No trigger, no trade.
Your Action Plan
I do not have a position in WMB. This is a watchlist name.
WMB is currently trading above $71.51. What I am watching for is a pullback to that level. If the stock pulls back to around $71.51 and holds, that gives me a clean entry with the trend still intact and the squeeze still loaded.
The target from there is a run back toward the recent highs at $76.87.
What would change my read is a clean daily close below $70. If that happens, the structure breaks and this setup is off the table. I walk away and wait for a better entry.
The trend is intact. The pattern is tight. The squeeze is loaded. The business has record earnings and a multi-year AI tailwind that existed before the headlines and will exist after them.
Now we wait for the trigger. If you want to see exactly when I pull the trigger, live and in real time, join me every day in Daily Profits Live.
I trade this system in front of you, start to finish, every market session. When WMB fires, you will know the second I do.
More from Wake-up Watchlist

The Defense Play I’m Watching This Week
Mar 24, 2026


Mar 20, 2026