“When you see a daily squeeze aligning with bullish EMA stacks in a sector showing fundamental strength, that’s when the biggest moves often materialize.”
Editor’s Note: MTA’s Urgent “Tariff Protection” Summit
LIVE: Friday, March 7th at 12:00 EST
**FREE for all MTA Members**
As Stocks Violently Dip & Rip With Each New Tariff Threat…
Bryan & Karim Reveal Five (5) Top Picks to Protect You Against Bowel-Shaking Tariff Volatility
Drop Whatever You’re Doing & Join Bryan & Karim LIVE This Friday Afternoon: Your Money is TOO Important
YES!!!!!!!! SECURE MY FREE RSVP TO MTA’S URGENT “TARIFF PROTECTION” SUMMIT
RSVP Your Spot: https://mtatrader.pro/ynn
– Ryan Fitzwater, Publisher
Market volatility has been the name of the game lately, and we’re seeing some wild swings as traders try to digest tariff news, economic data, and sector rotations all at once.
The major indexes have been bouncing around like a ping-pong ball – up one day, down the next – as Wall Street tries to figure out what these tariff proposals actually mean for different sectors.
Just the other day, we saw the S&P 500 giving back all its post-election gains while the Nasdaq flirted with correction territory.
But that’s exactly the type of choppy, uncertain environment where specific stock setups become even more valuable.
When the broader market lacks direction, individual technical patterns can be your secret weapon – and that’s why GDX has caught my attention today.
What Caught My Eye?
The S.A.M. AI Scanner just flagged something significant: a fresh daily squeeze forming while GDX consolidates just below its 52-week high of $44.29 with perfect EMA alignment on both daily and weekly charts.
The Technical Picture

Daily Squeeze Setup
A daily squeeze represents one of the most reliable precursors to explosive moves in any market. This powerful technical pattern forms when volatility contracts dramatically on the daily timeframe.
Technically speaking, a squeeze occurs when Bollinger Bands (which measure standard deviation) move inside of Keltner Channels (which measure average true range).
This compression essentially means the market is “holding its breath” before making its next significant move.
With GDX trading just ~6% below its 52-week high, we have a clear level to trade against.
This type of consolidation near previous resistance, coupled with a daily squeeze, often precedes powerful breakouts that catch most traders by surprise.
Think of it like pressure building in a system – the longer and tighter the consolidation, especially near previous resistance, the more powerful the eventual move tends to be.
When these squeezes finally “fire,” they typically generate momentum that can carry prices significantly higher, especially in the context of our current market environment.
EMA Stack Analysis
- Perfect bullish alignment of daily EMAs (8, 21, 34, 55)
- Weekly chart showing strong uptrend confirmation
- Price consistently finding support at key EMA levels
- Higher lows forming across all relevant timeframes
When we see EMAs stacked in perfect order (shorter time frames above longer ones), it signals what traders call a “bullish ladder” – one of the most reliable indicators of upside momentum.
This alignment creates a cascade of support levels underneath current price action. Each EMA essentially acts as a potential floor during pullbacks, with institutional buyers often stepping in at these key technical levels.
The clean stacking we’re seeing in GDX suggests institutional accumulation and trend strength that most retail traders completely miss.
This orderly progression from shortest to longest timeframe EMAs provides both confirmation of the current trend and confidence that any pullbacks are likely to find support.
What is GDX?
The VanEck Gold Miners ETF (GDX) provides exposure to the world’s largest gold mining companies. Unlike buying physical gold, GDX offers leverage to gold prices through the operational efficiency of mining companies.
When gold prices rise, mining companies typically see amplified returns due to their cost structures – their fixed costs remain relatively stable while the value of their product increases.
This operational leverage makes GDX particularly attractive during gold bull markets.
Sector Tailwinds
While my approach is primarily technical, it’s impossible to ignore the powerful fundamentals supporting this setup:
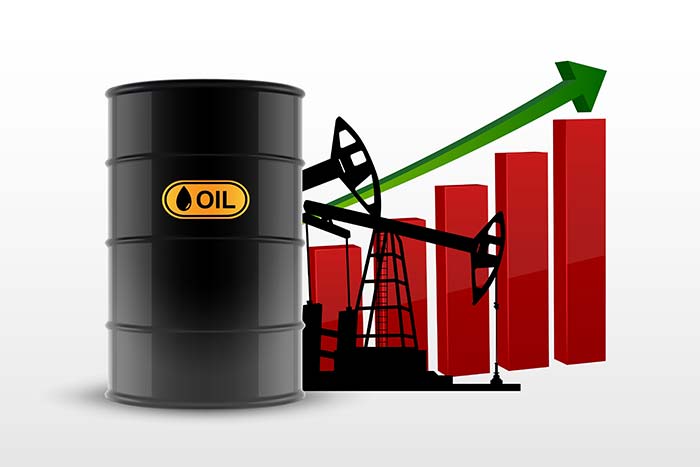
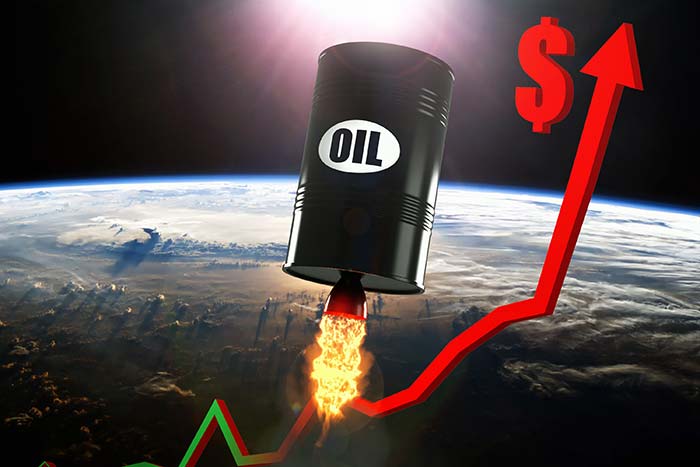
Gold and silver prices have been surging while oil prices are plummeting (just hit their lowest levels since May 2023). This creates a perfect storm for miners whose profit margins stand to expand dramatically as their input costs drop while their product value rises.
Combined with dollar weakness and rotation away from overextended tech stocks, precious metals are positioned as one of the strongest sectors in the current market environment.
Your Action Plan
I don’t currently have a position in GDX, but I’m watching it closely for entry opportunities. With options unusually cheap right now, this presents a rare chance to position with longer-dated contracts without paying excessive premiums.
Want to find A+ setups like this?
Click here to learn more about Profit Surge Trader.
Find out how to get my exact entries, exits, and position-building strategies as they happen.
Click here to join Profit Surge Trader now and trade alongside us.