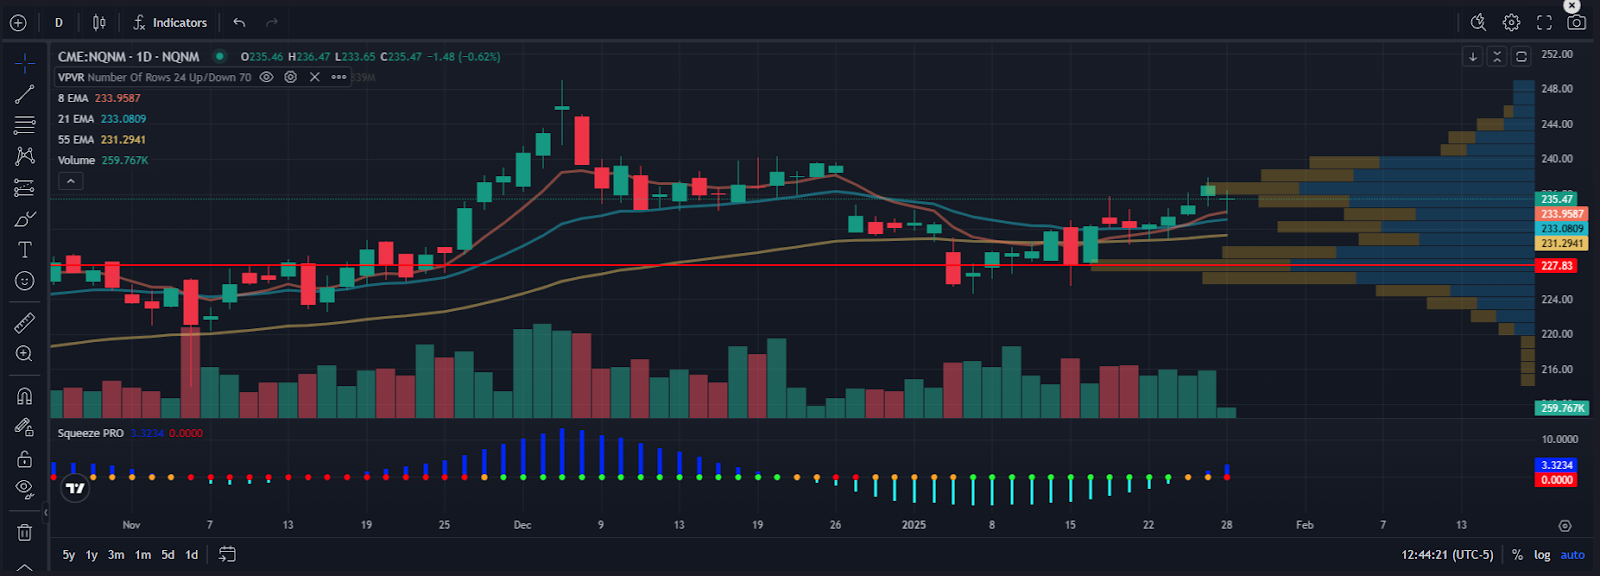
“With perfect EMA stacks and a daily squeeze near 52-week highs, CME is uniquely positioned to benefit from surging market volatility.”
This week marks a critical period for the market, with major companies like Microsoft (MSFT), Meta (META), and Tesla (TSLA) reporting earnings today.
These events come on the heels of the recent $1 trillion wipeout in tech stocks caused by the DeepSeek threat, which rattled markets and created massive volatility and unusual trading volume.
While this selloff has shaken investor confidence, it also creates a favorable backdrop for CME Group (CME), the world’s largest derivatives and futures platform.
As volatility increases, so does trading activity on CME’s exchanges, which drives higher revenue for the company.
Amid this backdrop, CME is trading just off its 52-week high of $242.98 and is showing a textbook daily squeeze alongside stacked EMAs on both the daily and weekly charts.
This alignment signals a potential breakout, and the S.A.M. AI Scanner has flagged CME for its coiled price action and bullish momentum across multiple timeframes.
Let’s break it down…
The Technical Picture
Squeeze Setup
CME’s chart is displaying a daily squeeze, a technical pattern that occurs when price volatility contracts, creating a “coiling” effect. This compression often leads to explosive moves when volatility expands, and CME’s current setup is primed for such a breakout.
Here’s why this squeeze matters:
- Flagged by S.A.M. AI Scanner: The scanner identified CME’s low-volatility compression, signaling the stock is building energy for its next move.
- Proximity to 52-Week High: CME is consolidating just below $242.98, its 52-week high. Breaking above this key resistance could trigger significant upside momentum.
- Institutional Accumulation: The tight consolidation suggests that large players are positioning themselves ahead of a potential breakout.
This squeeze setup aligns perfectly with the heightened volatility created by this week’s earnings reports and the recent DeepSeek-driven selloff, making CME an attractive trade idea.
EMA Stack Analysis
CME’s technical setup is further strengthened by its perfect EMA alignment on both daily and weekly timeframes:
- Daily EMA Stack (8, 21, 34, 55): Shorter EMAs are stacked above longer ones, a classic signal of bullish momentum.
- Weekly Chart Confirmation: The weekly chart shows higher lows and sustained support at key EMA levels, confirming the broader uptrend.
- Support at Critical Levels: CME’s price has consistently found support at key EMA levels, indicating strong buying interest.
- Multi-Timeframe Alignment: The alignment of daily and weekly trends increases the probability of a strong breakout move.
This EMA structure, often referred to as a “bullish ladder,” suggests that both short-term momentum and the broader trend are pointing higher, making CME’s setup even more compelling.
Why Volatility Is Bullish for CME
The recent DeepSeek-driven selloff wiped out $1 trillion in market value on Monday, creating massive volatility and unusual trading volume across the markets.
While this rattled tech stocks, it benefits CME’s business, as the company thrives during periods of heightened market activity.
Here’s why this is bullish for CME:
- Increased Trading Volume: As investors hedge their positions and speculate in volatile markets, trading activity on CME’s exchanges surges, driving higher transaction revenues.
- Market Leadership in Futures and Options: CME is the go-to platform for derivatives trading, benefiting directly from the spike in market uncertainty.
- Massive Earnings Week Adds to Volatility: With MSFT, META, and TSLA reporting today, and a Fed meeting also today, volatility is likely to remain elevated, further boosting CME’s trading volumes.
CME’s unique position as a beneficiary of market volatility makes it a standout opportunity in the current environment.
Your Action Plan
CME is presenting a prime technical setup, with a daily squeeze, perfectly stacked EMAs, and elevated trading volume driven by heightened market volatility. Opportunities like this require discipline and precision—and I want to show you exactly how I tackle them.
That’s why I’m inviting you to join me for my AI Power Blitz this Thursday, January 30th, from 2:00 PM to 4:00 PM EST (1:00 PM to 3:00 PM CST).
During this live event, I’ll use my AI-powered scanner, S.A.M., to hunt down explosive trade setups—just like CME—in real time.
Over the past year, I’ve scored massive wins like 100%, 287%, and even 1,129% in just DAYS during my trading blitzes, and now you’ll get the chance to see exactly how I do it.
Here’s what’s happening during the AI Power Blitz:
- I’ll show you how to use AI to find high-probability setups FAST—within just a two-hour window.
- You’ll get a first look at brand-new tools designed to revolutionize how traders find massive trades.
- And, most importantly, we’ll look for real, actionable trades LIVE.
This event is FREE and will be streamed live inside the Monument Traders LIVE chat room.
The room opens at 1:45 PM EST, so come early to chat with other traders and make sure everything’s working smoothly.