The Best Business in the World Just Had Its Worst Month Since 2000
Here’s a question for you…
What do you do when a company beats earnings eight quarters in a row… and the stock drops 24% anyway?
Most people freeze. They stare at the fundamentals, scratch their heads, and wonder how a business growing revenue 16–18% year over year can possibly be down that much. They trust the business and ignore the chart.
That’s the mistake.
I don’t trade businesses. I trade charts. And right now, the Microsoft (MSFT) chart is telling me something very specific.
The Trend Nobody Wants to Say Out Loud
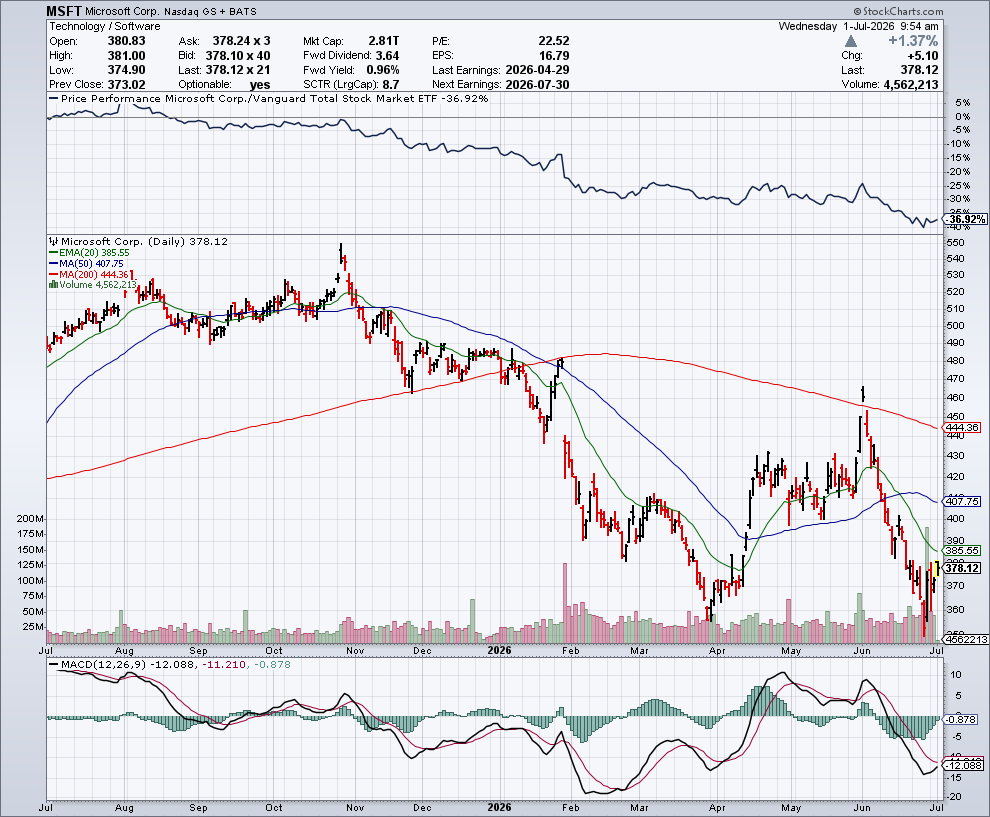
June 2026 was Microsoft’s worst month since December 2000. Down roughly 20% in a single month. Worst first half of a year in a quarter century. Down 24% YTD while the S&P 500 is up 7%.
The reasons aren’t hard to find.
Microsoft is projected to spend $190 billion on AI infrastructure in fiscal 2026, and Wall Street is starting to ask whether the returns will ever justify that number.
Physicists published a critique in Nature questioning the scientific foundation of Microsoft’s quantum computing roadmap.
Xbox hardware revenue fell 33% year over year.
Layoffs are coming, possibly affecting 2.5% of the workforce.
Meanwhile, the underlying business keeps beating estimates.
That disconnect (great fundamentals, terrible stock performance) is exactly the kind of confusion that creates a squeeze.
The trend is clear: lower highs, lower lows, price below both the 50-day and 200-day moving averages. From an all-time high near $555 to roughly $373 today. That’s the trend. Don’t fight it.
The Pattern Is a Pivot Point
MSFT hit a pivot bottom on June 25 at approximately $349. Since that low, the stock has bounced up about 5–6% in the final days of June. That bounce is now being tested.
More from Wake-up Watchlist

Healthcare Is No Longer Dead Money.
Jul 23, 2026

3 Stocks At All-Time Highs Just Got Downgraded
Jul 22, 2026