The Market Feels Different. Here’s What To Watch.

If you’ve been investing for any length of time, you’ve probably caught yourself asking the same question over the past few weeks:
“Is this starting to look like another dot-com bubble?”
It’s a fair question, especially if you’ve been tuning in to Wall Street’s media machine.
The late-1990s technology boom remains the benchmark investors use whenever valuations become stretched, optimism reaches extreme levels, and a handful of companies begin carrying the broader market higher.
More importantly, it’s the type of event investors want to avoid because the damage to long-term wealth can take years to recover.
Today, there are certainly comparisons that can be made.
That said, I’ve yet to see firm evidence that we’re witnessing the beginning of another 2000-style bear market. Sure, there are cracks, but this market continues to remind me of 1998, more than 2000.
That distinction is important.
My job isn’t to predict headlines. It’s to measure risk, follow the data, and identify changes before they become obvious to everyone else.
Right now, the indicators suggest investors should remain disciplined, not fearful.
Summertime Volatility
 |
One factor working in the market’s favor is the calendar.
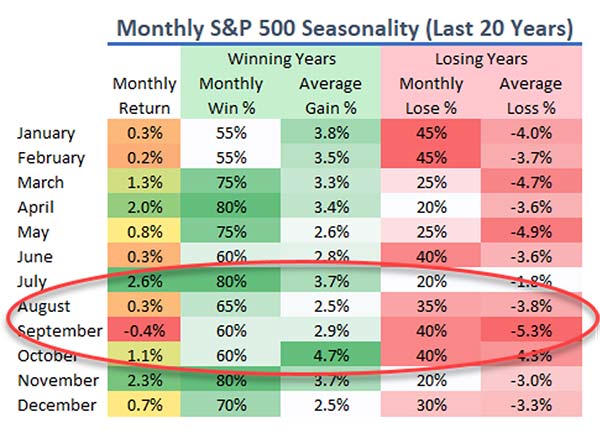
Although volatility typically increases during the summer months, July has historically been one of the strongest months for the S&P 500.
The math behind that trend is straightforward. Three of the market’s strongest months over the last 20 years have coincided with the start of quarterly earnings season.
Unexpected positive earnings create confidence, confidence attracts institutional capital, and that capital flow has historically supported higher stock prices.
This sets up nicely for the next few weeks, but investors should expect volatility and selling pressure to pick up in the historically slower months of August and September.
Changing of the Guard
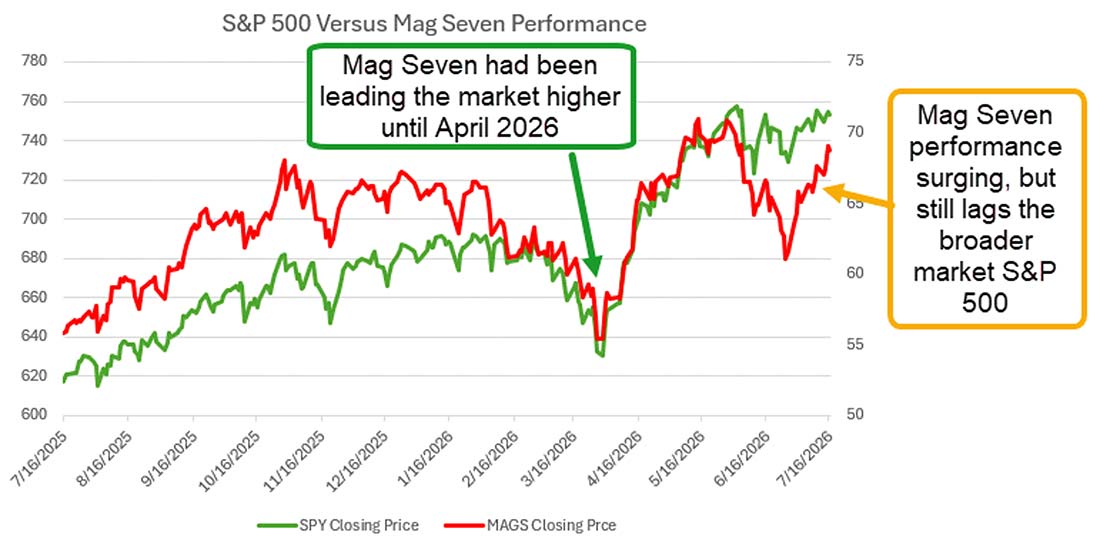
One of the more interesting developments during the past two months has been the change in market leadership.
The Nasdaq 100 has largely traded sideways while software stocks and much of the large-cap technology complex have struggled to generate new momentum.
At the same time, memory-related semiconductor companies have become the strongest area within technology as investors continue rewarding companies benefiting directly from AI infrastructure spending.
More importantly, the traditional leadership group has taken a noticeable step back.
And while the broader Nasdaq 100 has continued to advance this year, the Magnificent Seven have contributed very little to recent market gains.
|
That isn’t necessarily a bearish signal.
Instead, it reflects growing investor concern over the enormous capital expenditures being made by hyperscale AI companies.
Investors understand why those investments are necessary. The question is how long elevated spending will pressure profit margins before those investments begin producing meaningful returns.
That debate is likely to define the next several quarters for large-cap technology.
The Story’s Still Strong
Away from technology, the market continues sending encouraging signals.
The consumer has remained remarkably resilient despite persistent inflation. Employment remains healthy, spending has held together, and economic activity continues to exceed expectations.
June’s inflation report came in cooler than economists expected, but inflation remains above the Federal Reserve’s long-term objective.
Recent comments from voting FOMC members suggest additional rate hikes remain possible if inflation progress stalls. Even so, markets continue expecting the Fed to leave interest rates unchanged at its July meeting.
Those expectations have helped support areas of the market that typically benefit from lower borrowing costs.
Financial stocks, regional banks, and small-cap companies have quietly become some of this year’s strongest performing groups.
The Russell 2000 and Regional Banking ETF have both outperformed many of the larger technology benchmarks.
That rotation suggests investors are positioning for a broader economic expansion rather than concentrating exclusively on AI.
If inflation continues moderating and interest rate expectations begin moving lower later this year, those areas could continue attracting institutional capital.
Geopolitical Risks Remain
Markets have also demonstrated surprising resilience in the face of elevated geopolitical uncertainty.
Historically, prolonged bull markets often become characterized by investors’ ability to look through headlines and focus on earnings and economic fundamentals. We’re seeing that this year, too.
The ongoing Iran conflict continues to influence energy prices.
Higher oil prices increase transportation costs, manufacturing expenses, and ultimately consumer prices.
We’re beginning to see pressure develop among several large consumer retailers as they balance slowing consumer demand with rising operating costs. Companies like Walmart (WMT), Costco (COST) and Kroger (KR) could face increasing margin pressure if higher energy costs persist.
For now, these remain isolated concerns rather than evidence of widespread economic deterioration.
Earnings: The Primary Driver
Over the next several weeks, earnings season will determine the market’s next major move.
Financial results have been encouraging so far, but the real test begins when large-cap technology companies report over the next two weeks.
The catch… expectations for earnings in general remain extremely high. Technology MUST impress in order to keep long-term positive momentum.
In many cases, stocks are priced for near-perfect earnings results. This means that strong quarterly results alone may not be enough. Investors will also be looking for meaningful increases in revenue guidance and earnings forecasts to justify continued AI spending.
More importantly, management teams must convince investors that today’s elevated capital expenditures will translate into tomorrow’s stronger profits.
That makes the Nasdaq 100 the highest risk-and-reward index heading into earnings season.
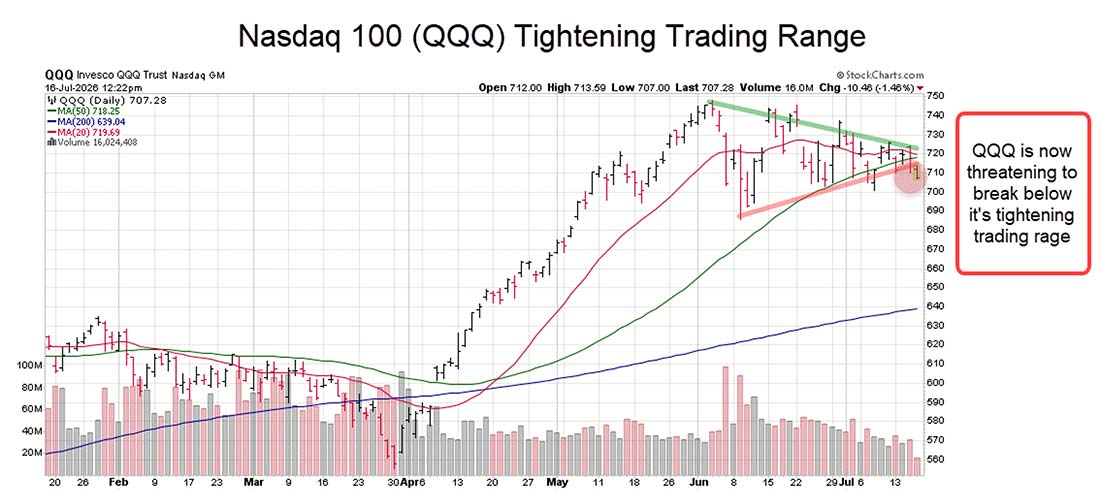
Technically, the index has spent nearly two months building a tightening consolidation pattern.
|
Historically, patterns of compression like this are followed by significant directional moves.
Based on the current structure, a move of 10% to 15% over the coming months wouldn’t be unusual, but earnings over the next two weeks will determine the direction.
The Bottom Line
From a technical perspective, today’s market closely resembles the setup we saw at the beginning of 2026.
Yes, momentum has slowed…
Valuations and expectations are high…
And seasonality is less favorable during the summer months.
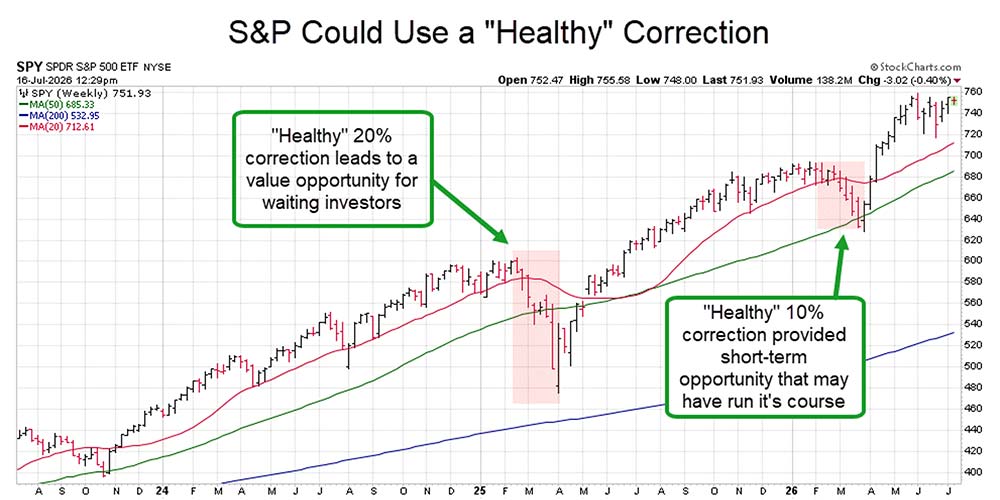
Those factors increase the probability of a short-term correction.
Important note: a correction and a bear market are not the same thing.
A healthy pullback would likely create exactly what long-term investors have been waiting for: better valuations, improved risk-reward opportunities, and attractive entry points into quality companies.
|
At this point, the indicators simply don’t support the conclusion that we’re on the cusp of a major bear market.
Could that outlook change? Absolutely.
That’s why we monitor technical conditions, earnings trends, institutional money flows, market breadth, and volatility every day.
If the evidence changes, you’ll hear about it.
Until then, the data continues to support patience, discipline, and preparation rather than fear.
Below, I’ve included the key ETFs and technical price levels I’m monitoring most closely. If those levels begin to fail in meaningful ways, my outlook will change with them.
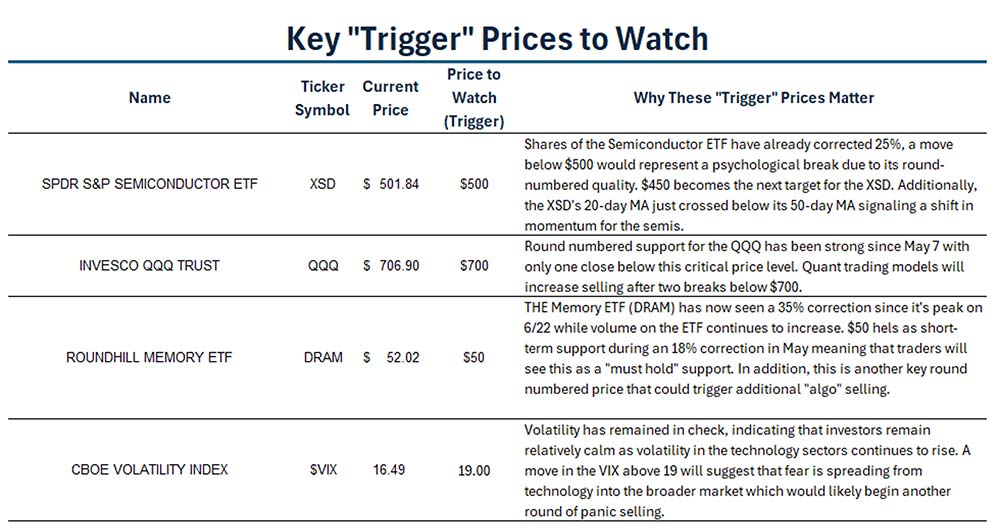
|
For now, the evidence continues to favor staying invested, remaining selective, and allowing the data (not emotions) to guide your decisions.
More from Trade of the Day

Gold Just Went on Sale – But the Reason Won’t Last
Jul 17, 2026
Saddle Up Sally! The Hottest Trend in Retail
Jul 15, 2026