The Earnings Calendar Trick Wall Street Doesn’t Talk About

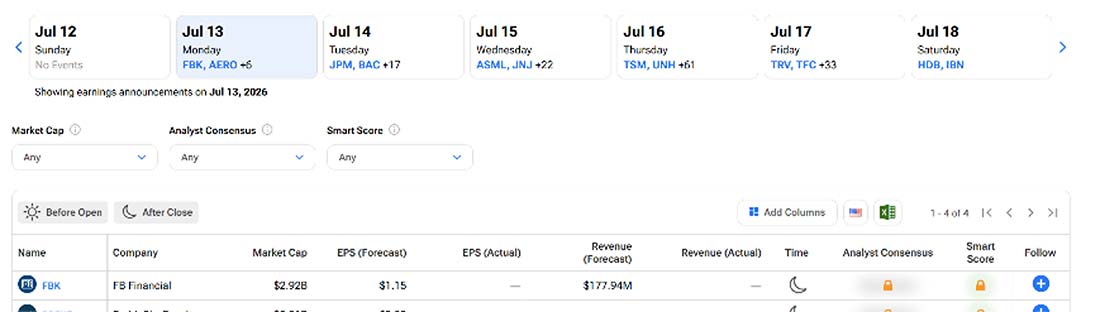
Most investors head into the earnings season with one familiar tool: the earnings calendar.
But the calendar can be hell to go through, especially when the reports start to flow heavily in a few weeks.
|
There’s a better way to consume (and profit from!) this data.
Let’s start with a simple idea…
The stock market isn’t driven by headlines.
Sure, a headline can make a stock jump or fall for a moment in time, but those movements usually fade into little more than noise in the longer trend, right?
Wrong. Those long-term trends are driven by trillions of dollars moving from one group of stocks to another as investors, especially institutions, constantly reassess where capital should be invested.
The good news is that those decisions aren’t random.
As usual, they’re surprisingly mathematical. If you can quantify when money is most likely to move, you can often identify trends before they become obvious to everyone else.
That’s exactly what I’ve found by studying trends in the earnings calendar.
Most investors think of earnings season as a collection of individual company reports. They focus on whether JPMorgan (JPM) beats estimates, whether Bank of America (BAC) raises guidance, or whether Goldman Sachs surprises Wall Street.
They’re looking at the trees.
I look at the forest.
When you organize earnings announcements by the 11 Standard & Poor’s sectors instead of individual companies, something remarkable appears.
Earnings don’t occur evenly throughout the year. Instead, they arrive in clusters that are focused on each of those 11 S&P 500 sectors.
The 11 clusters frequently coincide with periods when institutional investors are making large allocation decisions within an entire sector.
That creates a measurable and repeatable opportunity for you.
Financials Are First
Let’s look at the math.
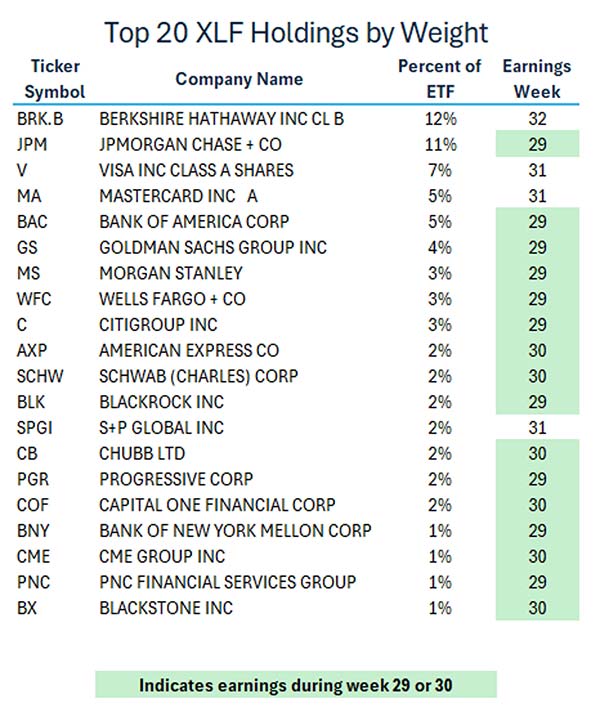
As earnings season begins this week, nearly 42% of the companies represented in the Financial Select Sector SPDR ETF (XLF) will report quarterly results over the next five days.
|
This isn’t just a busy week for earnings. It’s one of the four periods during the year when nearly half of the financial sector’s weighting delivers fresh information to investors.
The largest holdings carry even more influence.
JPMorgan represents roughly 11% of the XLF, while Bank of America accounts for another 5%.
When companies that big report within a matter of days, it usually becomes a catalyst for broad sector-wide repositioning.
That’s especially important today because the financial sector has already been trending higher for more than six weeks. The trend is strong, which means that something dire would have to happen over the next week for it to come to an end.
Improving economic expectations, stabilizing interest rates, and a rotation of capital away from some of the largest technology stocks have already attracted money into financials.
Increasing the bullish potential this quarter is the market’s view on the AI trade.
Investors have been increasingly concerned about the volatility and possible fragility of the semiconductor, memory, and hyperscalers as many indications are suggesting that a bubble has been inflating. The financials have benefitted from the derisking that has seen some cash flow away from these groups.
Now investors receive the confirmation (or rejection) they’ve been waiting for on the financials. Confirmation will result in another surge of cash flows into the sector.
The Math Is Hard to Ignore
The concentration of earnings announcements isn’t random.
Neither is the market’s response.
My research shows that nearly half of the XLF’s component weighting reports earnings during the 4th, 16th, 29th and 42nd weeks of the calendar year.
Those four earnings clusters produce a noticeable change in performance.
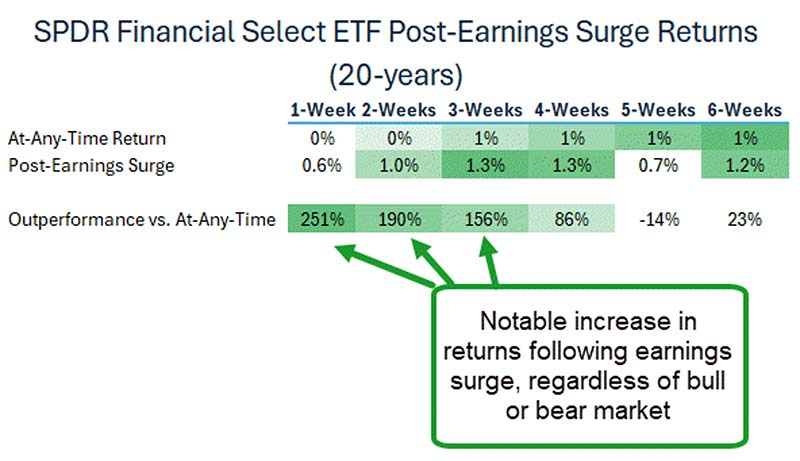
At any point during the year, XLF averages approximately 0.2% over a one-week period and roughly 0.3% over two weeks.
During these earnings clusters, those returns improve by 251% over the following week and by 190% over the subsequent two-week period.
|
That’s not because earnings magically make stocks go up.
It’s because earnings provide institutional investors with new information that often confirms or changes their outlook for an entire sector.
When dozens of companies report within days of one another, portfolio managers don’t simply buy one stock. They frequently adjust exposure across the entire group.
That’s the money flow we’re trying to identify.
Finding Even More Alpha
Sector ETFs are only the first step.
The larger opportunity often lies inside them.
Once you identify a sector entering one of these earnings clusters, the next step is to focus on the companies carrying the greatest weight within that ETF.
Those stocks receive the largest share of institutional buying and selling.
In financials, that starts with JPMorgan.
Since 1983, JPM shares have outperformed their normal post-earnings performance by 63% over the following week, 75% over two weeks and 94% over the three weeks following earnings.
Those results include both bull and bear markets.
The takeaway isn’t that JPM always rallies after earnings.
It’s that when the trend is already pointing higher, earnings often become the catalyst that accelerates institutional money flow into the stock.
That’s exactly the type of mathematical edge we’re looking for.

YOUR ACTION PLAN
The financial sector enters earnings season with improving technical momentum, strengthening capital flows, and one of the largest earnings concentrations of the quarter.
That’s a combination I like, and I think XLF continues the broader sector trend.
For investors looking to pursue greater upside potential, JPMorgan remains my preferred large-cap financial heading into earnings because of its dominant weighting within XLF, its historical post-earnings tendency to attract institutional buying, and its leadership position within the sector.
The market rewards investors who can identify where money is likely to move before everyone else recognizes the trend, and the earnings calendar sector clusters provide one of the clearest tools for doing exactly that.
But the money flow driving XLF this week is just one piece of a much bigger rotation playing out right now.
Nate Bear is mapping the full picture, sector by sector, in his free live briefing tomorrow at 2 p.m. ET, showing you where institutional capital is headed next before it becomes obvious.
Save your seat, and get positioned ahead of the crowd.
More from Trade of the Day

Gold Just Went on Sale – But the Reason Won’t Last
Jul 17, 2026

The Market Feels Different. Here’s What To Watch.
Jul 16, 2026

Saddle Up Sally! The Hottest Trend in Retail
Jul 15, 2026