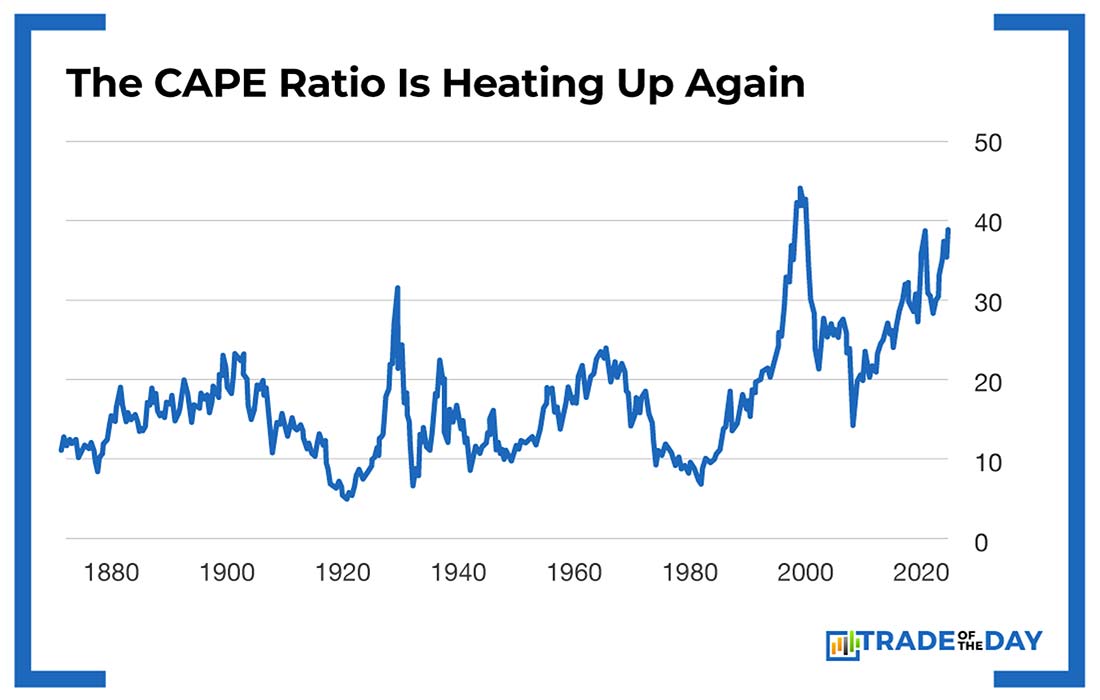
CAPE Ratio at 38.81 (This Is Not a Drill)

Back in late February, I warned you the market was priced for perfection.
The CAPE ratio was screaming overvaluation, and I compared buying stocks to paying $20 for a cup of coffee.
One month later?
The Nasdaq crashed from 20,000 to 15,500 – a brutal +20% drop that wiped out trillions.
But get this: We’re back at record highs with the CAPE ratio sitting at 38.81. That’s not just expensive anymore – that’s like paying $40 for that same cup of coffee while everyone around you cheers about the “amazing deal.”
Are we seriously doing this again?
What Is the CAPE Ratio (And Why It Nailed the February Crash)
For those just joining the party, the CAPE ratio – Cyclically Adjusted Price-to-Earnings ratio – is like having X-ray vision for market valuation. It takes the current stock price and divides it by the average inflation-adjusted earnings over the past 10 years.
CAPE Ratio = Current Stock Price / Average Inflation-Adjusted Earnings (Last 10 Years)
Here’s what matters:
- CAPE below 15: Market’s on clearance
- CAPE 15-25: Fair value territory
- CAPE above 30: You’re paying Rolex prices for a Timex
At 38.81, we’re in bubble territory. The only time it was higher? Right before the dot-com crash when it hit 44.
The February Warning That Everyone Ignored
When I wrote about the CAPE ratio in February, the financial media was drunk on “AI revolution” stories and “soft landing” narratives.
Meanwhile, the CAPE ratio was flashing red like a fire alarm in a burning building.
Then March happened. The Nasdaq face-planted +20% in just a few weeks, exactly like the CAPE ratio predicted.
Those European markets I recommended? They held up much better.
This Bubble Is Even More Dangerous
What makes 38.81 terrifying: We just had a major correction, and instead of staying cautious, everyone piled back in like nothing happened.
Look at what’s driving these highs: Microsoft hit a $4 trillion market cap. Meta jumped 11.5% in a single day on earnings.
Classic bubble behavior – good news becomes an excuse for even more irrational exuberance.
Every valuation metric is screaming the same thing. P/E ratios well above historical norms. Tech companies trading at massive premiums to book value. Market cap approaching dangerous levels relative to GDP.
This market is priced for absolute perfection in a world where nothing ever goes perfectly.
What I’m Doing About It
I’m not waiting for the next crash. Here’s my positioning:
Reducing high beta exposure: When valuations are this extreme, smart money reduces risk. I’m not adding to overvalued positions.
Generating income: Like the strategies I teach in the War Room.
Building cash: The next correction will create incredible buying opportunities, but only if you have dry powder.
The Pattern Never Changes
What drives me crazy: The pattern never changes, but people always think “this time is different.”
I saw it coming in February. The CAPE ratio saw it coming. The crash happened exactly on schedule.
Now we’re back with the same tired arguments. AI is revolutionary! Earnings growth will justify these prices! The Fed will save us!
Bullshit. Math doesn’t care about your narrative.
![]()
YOUR ACTION PLAN
I called the February top when the CAPE ratio was lower than today. The market crashed exactly as predicted. Now we’re back at new highs with even more extreme valuations.
You can learn from history, or you can repeat it. But don’t say nobody warned you.
The CAPE ratio never lies. At 38.81, it’s screaming danger.
I’m listening. Are you?
If you want to follow how we’re going to play this, join us in The War Room.
More from Trade of the Day

How To Buy SpaceX Below Its IPO Price
Jun 19, 2026
The Options Market Is About to Change Forever
Jun 18, 2026

Why I Look Forward to the Slowest Months of the Year
Jun 17, 2026

Everyone’s a Genius at All-Time Highs
Jun 16, 2026