It’s Time to Pump the Brakes…

Hey Gang,
On Wed afternoon, in a span of less than an hour, I pulled the plug on four trades.
It was time to take risk off.
With the daily moving averages now shifting bearish short-term, I am switching to “sell the rally” mode.
You see, I didn’t become a millionaire trader by only trading bull markets, since markets trade sideways almost 75% of the time.
That’s why I designed my TPS strategy to incorporate the trend — up, down, or sideways.
No matter the market or the trend of a stock, I have a way to trade it.
So, instead of giving up on bullish TPS trades, it was time to incorporate some bearish ones into the mix.
That meant adjusting my SAM stock setup scanner to look for A+ bearish trades.
Here’s how I did that.
Recalibrating the Scanner
The SAM stock setup scanner is one of the most powerful tools developed in all my years of trading.
This incredible platform scans hundreds of stocks and calculates whether each ticker and timeframe combination meets a basic TPS or A+ setup.
Typically, I look for ones with green signals to go long.
However, the scanner also provides me with red signals for short trades as well.
For example, in the results below, I highlighted two stocks with a lot of bearish setups on multiple timeframes.
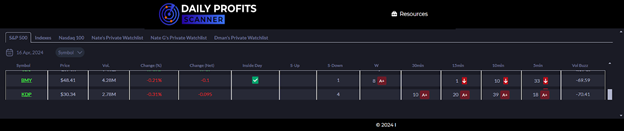
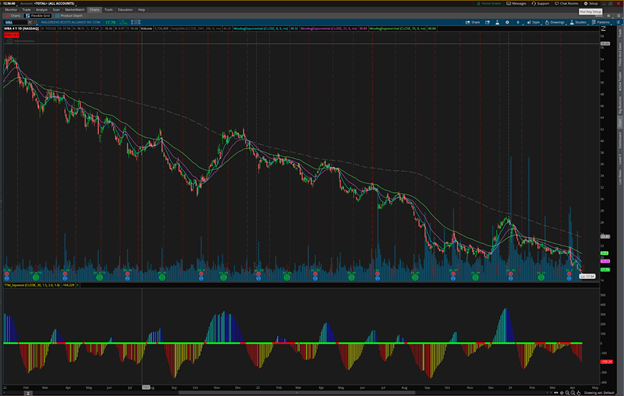
Let’s pull up a 15-minute chart of Keurig Dr. Pepper (KDP).
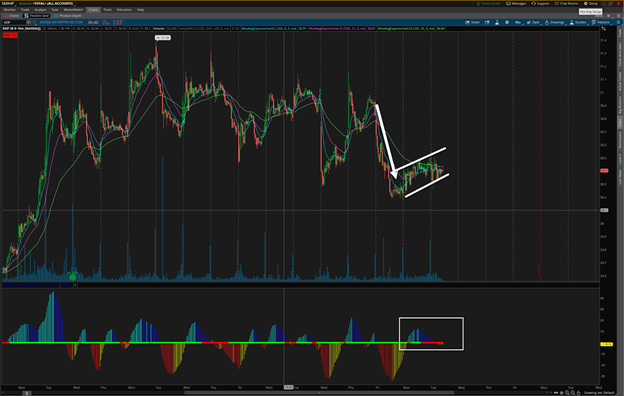
This setup has all the pieces for a TPS setup: trend, pattern, and a squeeze.
Plus, all the EMAs are stacked on one another with the 8 below the 21 which is below the 55.
However, you’ll notice that off to the left, this looks like a bearish pattern in a larger bullish one.
That’s only partly true. Because if you zoom out to the daily timeframe and look back even further, there’s a clear downtrend in KDP.
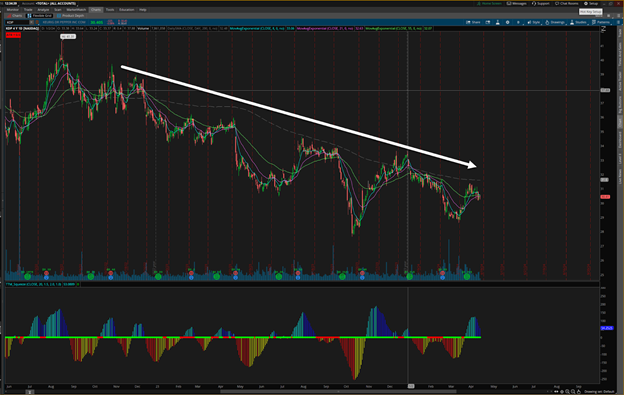
This is a decent stock to look for bearish plays to pair off with my bullish ones.
Arguably, a stock like Walgreens (WBA) would be even better since it’s in a very clear downtrend.
However, when stocks are coming off the tops of bull runs, there aren’t going to be many in perpetual downtrends.
So, I’m looking for relative weakness using bearish A+ setups.
Getting Tighter
The second major adjustment I’ll make is going to shorter timeframes.
When markets start to fall, they tend to do it quickly. However, the bouncebacks are just as violent.
So, rather than looking for A+ bullish setups on longer timeframes like the daily or weekly, I may start identifying setups on the 15-minute timeframe.
If markets are going to sell off, then I want to do what I can to reduce the risk that my position goes with everything else.
So, I’m going to look for relative strength.
One of my favorite stocks right now is Applied Materials (AMAT).
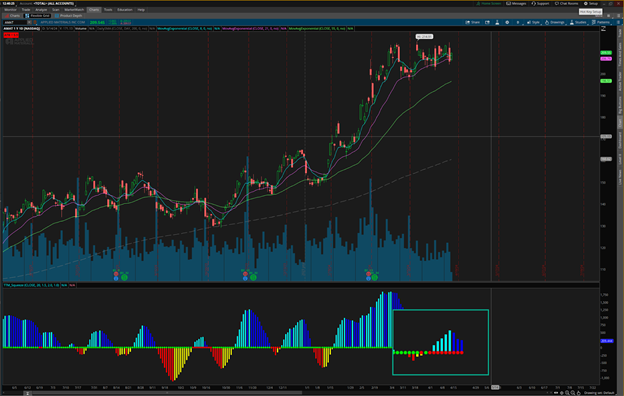
You can see on the daily chart above that despite the broader market weakness, this stock has held up quite well.
However, the momentum has turned south as is evidenced by the light blue lines turning dark blue.
But, if we drill down to a lower time frame, like the hourly, you’ll see there was a squeeze where the momentum was bearish but turned positive right before the squeeze fired and the stock popped higher.
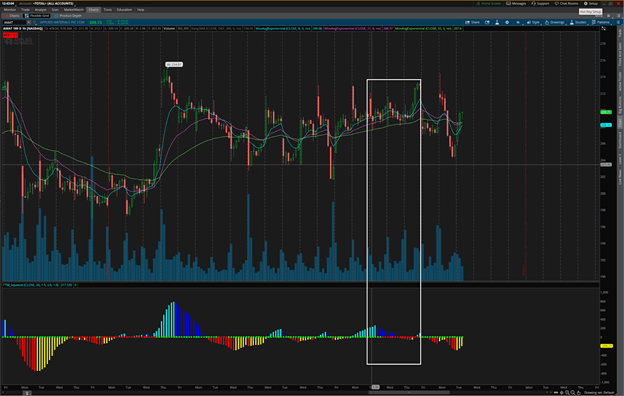
This isn’t a breakout trade where the stock is extending to new all-time highs.
And that’s not what I want to shoot for with all of them.
Instead, I’m looking to find pockets of strength and bullishness within the broader market.
A Pullback vs a Trend Change
How do you know whether you’re looking at a small pullback or a trend change?
As anyone who’s traded the market for a few years can tell you, this isn’t an easy question to answer, but it’s important you do,
With markets signaling shift, the next few weeks are critical.
Making the wrong decision can either leave you watching others scoop up the profits or turn your entire year upside down.
That’s why I’m inviting you to a full week of Daily Profits Live at NO CHARGE.
All next week, from 9am-4pm, you get full access to my LIVE trading sessions so you can see how I’m analyzing the markets, selecting trades, and managing risk.
Don’t take on this market by yourself.
I turned a $37,000 account into $2.7 million during markets that constantly changed.
I’ve helped thousands of folks learn how to navigate and trade using easy-to-follow setups.
Now is your chance to see how its done.
Click Here to Reserve Your Seat for a Full Week of Trading and Education.
– Nate Bear, Lead Technical Tactician
More from Trade of the Day

Gold Just Went on Sale – But the Reason Won’t Last
Jul 17, 2026
The Market Feels Different. Here’s What To Watch.
Jul 16, 2026
Saddle Up Sally! The Hottest Trend in Retail
Jul 15, 2026