Why Netflix Was a Better Trade Setup Than Nvidia Last Week
Hey gang,
These are the types of markets that I absolutely LOVE!
I wake up most days and find half a dozen fantastic setups.
However, I know it can be overwhelming, especially for newer traders. You don’t know which ones to take and feel like you miss the best ones.
Don’t worry… Papa Bear is here to help.
See, I’m just like everyone else. Sometimes, my emotions get the better of me.
So, when things get hectic, I like to slow them down and focus on my highest-quality setups.

Gotta stay cool, baby!
Honestly, there’s no better way to do that than to remove yourself completely from the equation.
That’s when I lean on my AI-Powered Scanner. We call him S.A.M. for short. The full name is Stock Acceleration Monitor.
S.A.M. is an absolute lifesaver when opportunities pop up quickly, and you have little time to spare.
In fact, I want to walk you through how I used it on Friday.
Because while everyone was busy watching NVDA and SMCI, S.A.M. caught a fantastic Netflix (NFLX) setup.
The Setup Basics
Anyone who’s been with me for a while knows that my favorite setup follows three letters:
- (T)rend – Stocks making an obvious move higher.
- (P)attern – Price enters a consolidation range that tightens
- (S)queeze – The Bollinger Bands move inside of the Keltner Channel
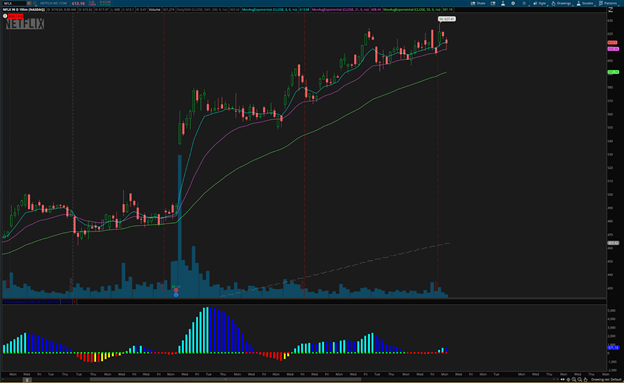
Here’s what that looked like on the 195-minute chart for Netflix.
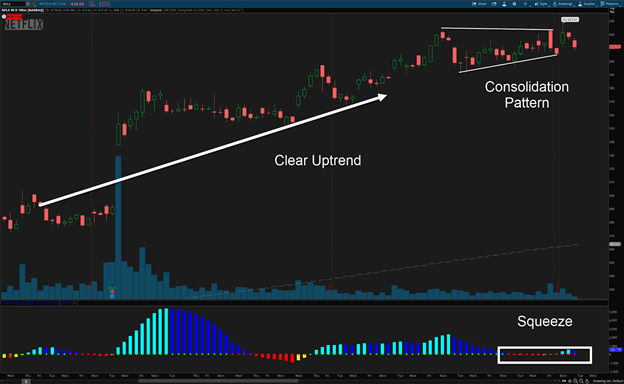
(Source: ThinkorSwim)
If you start at the bottom left and work your way right, you’ll see price marching higher clearly and steadily.
It doesn’t always have to be so linear – think Meta after its latest earnings.
I’m looking for a stock that hasn’t shown signs of aggressive or moderate selling.
This is the trend part of the equation.
The Pattern comes into play in conjunction with the Squeeze.
The two solid white lines contain the majority of the price action in that tight consolidation area.
This doesn’t have to be exact. Just make sure the boundary lines you draw capture 80%-90% of the price action AND the price range is contracting.
Lastly, we get the Squeeze, which is seen at the bottom with the red dots.
This signals when the Bollinger Bands move inside the Keltner Channel, creating the timing conditions for a breakout.
Since I trade options, the timing piece is crucial. I don’t want to enter trades too early and have the price of my option contracts eaten up by time decay.
That is all there is to the TPS setup.
From TPS to A+
So, what makes something an A+?
A+ setups happen when the 8, 21, and 55-period Exponential Moving Averages (EMAs) stack on top of one another.
For bearish setups, it’s stacked in the reverse order.
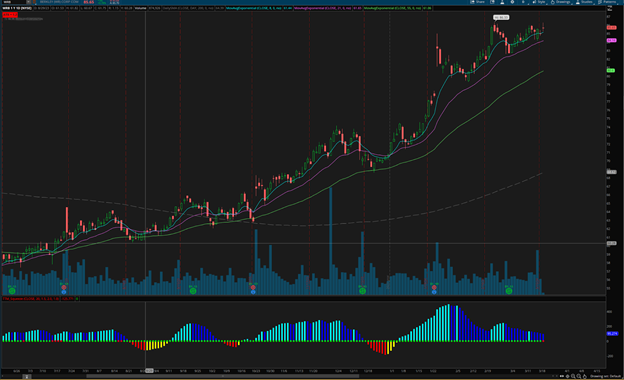
Here’s what that looked like with Netflix.
The 55-period (green) exponential moving average sits below the 21 (magenta) and the 8 (light blue).
Each is right on top of the other.
Generally, you’ll see this when a stock is floating higher.
It also happens a lot on smaller time frames as shown below with Meta on the 15-minute chart squeeze that happened a few days after its earnings pop.
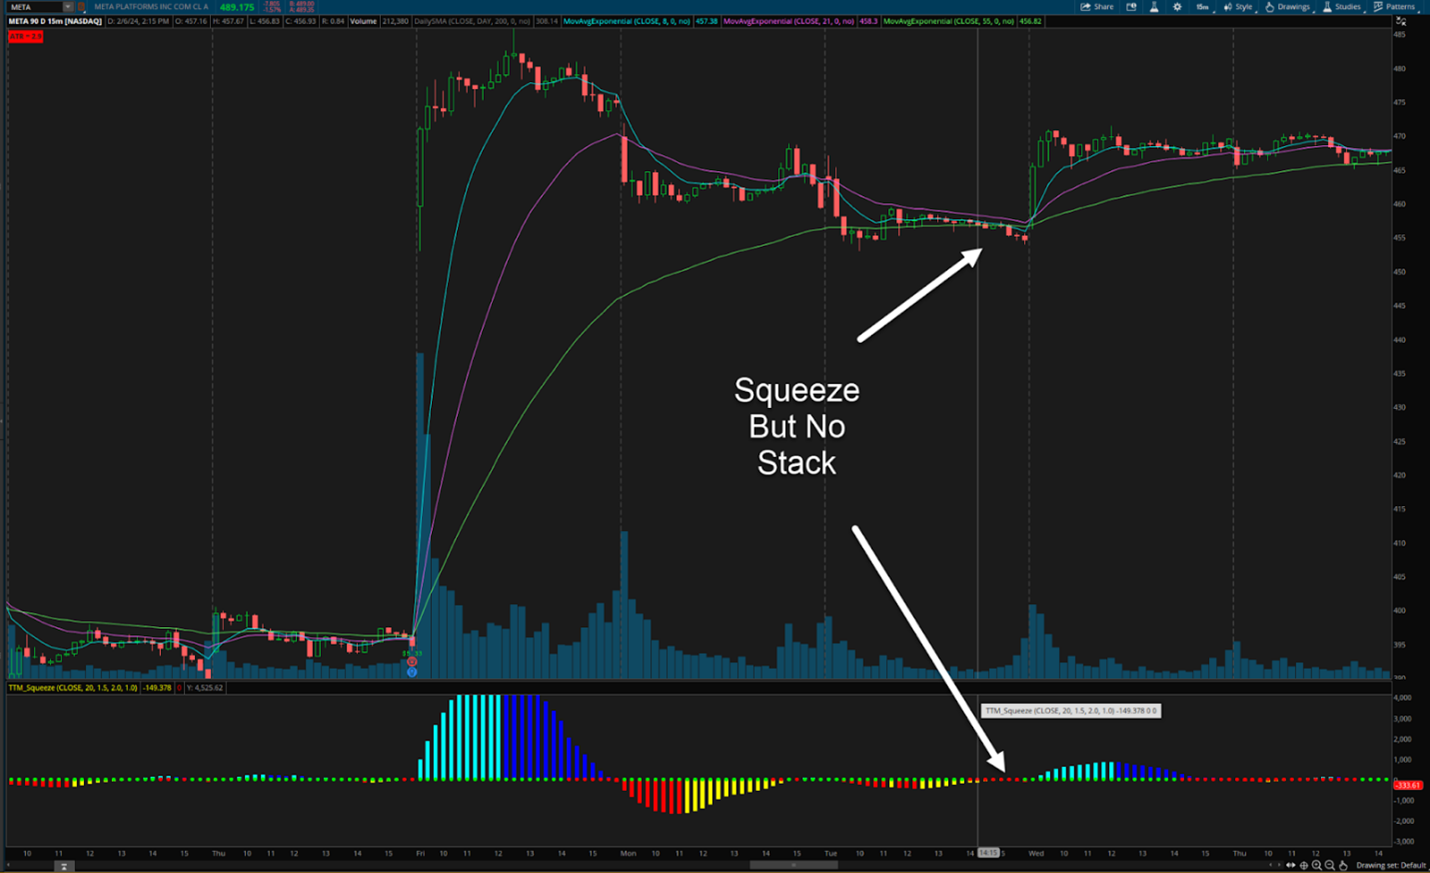
(Source: ThinkorSwim)
The EMA stack gives an extra kick to an already great setup.
From A+ to Top Trade
If we know what makes a TPS setup…and of those which are A+… how do we pick the best of the bunch?
The answer is actually quite simple.
You look for the one with the most A+ setups across multiple timeframes that meets our criteria that have enough liquidity.
When Netflix was picked up by S.A.M., there were A+ setups across multiple timeframes.
And Netflix certainly has enough liquidity (volume) on its options to make it tradeable.
However, not every stock with multiple A+ stacks are great setups.
Take a look at this list below:
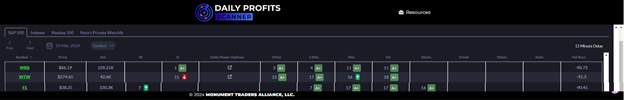
I cut this down to a handful of stocks with A+ setups.
The first stock looks very solid from its daily chart. Everything is in a nice uptrend with all the EMAs stacked.
The only problem is the options could be better.
You can only trade monthly expirations, and the volume on those is a few contracts for at-the-money strikes each day, at best.
That’s the same for the other two stocks on the list.
But I also want you to take a look at First Energy (FE).
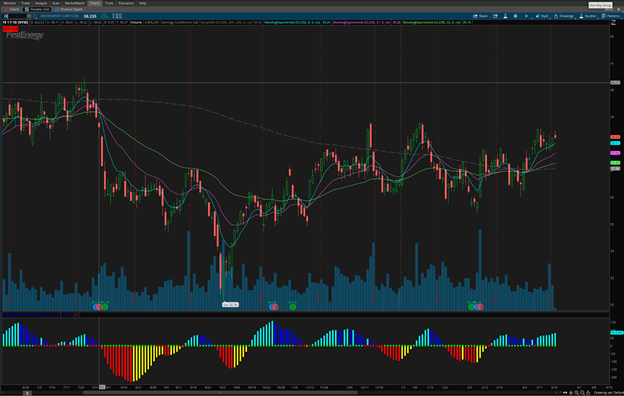
Despite the scanner saying the stock meets the criteria, I would say FE isn’t in a clear uptrend.
To me, this is a clear, drawn-out, sideways consolidation and not the type of setup I’m looking for.
Crafting the Trade
Once I’ve got the stock and the setup nailed down, it’s all about execution.
As an options trader, I like to buy calls and puts a bit in the money, typically around the +/- 70 delta.
For the expiration, I’ll typically choose one that’s 2x-3x longer than I expect the trade to take based on the timeframe.
With the Netflix trade, I was looking at the expirations for the following Friday since I was looking at the 30 to 60-minute timeframes for my initial focus.
Some traders may have wanted to play the 195-minute squeeze, which would take them out about 2-3 weeks for the expiration.
It’s all about how you want to play it based on your style and comfort level.
You want a position size that’s comfortable enough for you to hold that you’re worried about whether to cut the trade before it’s had a chance to work.
Action Plan
This might seem like a lot to take in. But with practice and patience, it’ll become second-nature.
There’s no better way to do this than in our Daily Profits Live room – where I also demo the power of my AI Scanner, S.A.M., every day of the week.
This month in Daily Profits Live, I’ve hit 28 winners for a 76% win-rate and 49% average gain – all in less than a 3 day holding period.
Whether you’re there for the trades as they happen, or reviewing them in the videos, this is the place to cut your learning curve and take your trading to the next level. Learn more here!
More from Wake-up Watchlist


Healthcare Is No Longer Dead Money.
Jul 23, 2026

3 Stocks At All-Time Highs Just Got Downgraded
Jul 22, 2026