Bounce Back or Bust? Unpacking This Market Madness

Hey Gang,
Everyone is worried about tomorrow’s numbers after last week’s tech selloff.
Even though stocks recovered most of their gains, the market’s fear gauge (also known as the VIX), closed the week at a multi-month high.
So, I wasn’t surprised when folks had a lot of questions to start Monday’s Daily Profits Live session.
That’s why today’s edition is dedicated to dissecting these market dynamics.
I’m going to walk you through:
- Decoding Major Market Patterns: We’ll delve into what these movements mean for the market at large and how they can influence your trading strategy.
- Exclusive Insights with the SAM Ai Trading Tool: I’ll share how this tool pinpoints A+ setups amidst market chaos.
- Strategic Position Sizing: Adjusting your stance in response to market volatility can be crucial. I’ll share my approach to managing risk while aiming for gains.
- Today’s Bonus: While I usually reserve specific trade ideas for our live sessions, I’m breaking the mold. Stick around for a standout setup poised for action.
Although the markets may be chaotic, it’s the process and strategy that set us apart.
Let’s dive in.
A Mixed Market Signal
Before I start looking for trades, I want to get a sense of what the markets are doing.
It’s pretty obvious to most of us that stocks have been moving higher almost nonstop since November.
That’s led to a bevy of A+ setups this year, so many in fact that I haven’t had a single loss this year in my Profit Surge Trader service.
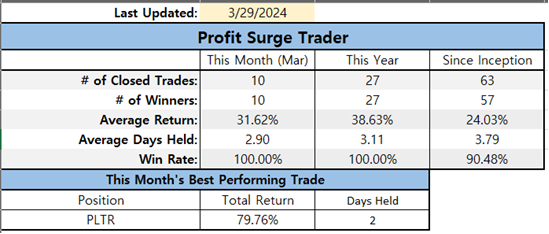
Click Here to see how Profit Surge Trader works.
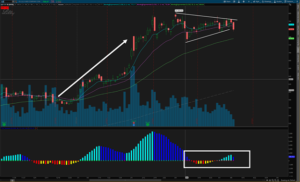
Now, take a look at the daily chart for the Nasdaq 100 ETF QQQ.
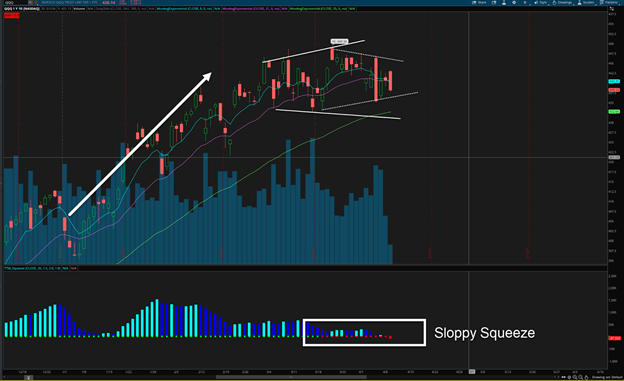
When I evaluate it for a TPS setup, here’s what I see:
- Trend: Very clear uptrend (that was never really in question)
- Pattern: There isn’t a clearly defined pattern here. The solid white lines connect the highs and lows. But this time, they are moving away from one another, not contracting. You could argue the dotted white lines are the correct pattern, but I don’t see it that way until it’s had more time to consolidate.
- Squeeze: The squeeze at the bottom is valid. But if you look closely, you’ll see the momentum shift up and down several times, indicating indecision.
The QQQs look like they could break out in either direction or keep consolidating.
That left me with a big question mark on the index that correlates the most with the stocks I trade.
Rather than fighting this, I embraced it and began to look for A+ setups from the SAM Ai Trading Tool.
And here’s what I found.
Setup Strength
For those of you who don’t know, my SAM Ai Trading Tool scans the market in real-time against the S&P 500 and other stocks to locate A+ setups.
A+ setups are ones with a great trend, pattern, squeeze, and the 8,21, and 55 EMAs stacked on top of one another.
Analyzing each chart individually isn’t hard. But, it can take 30-60 seconds. That makes looking at more than a few dozen stocks virtually impossible.
For example, This was what I pulled up around mid-morning in the LIVE room.
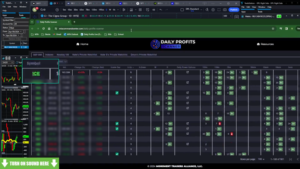
The initial results revealed dozens of juicy setups.
However, I want to focus on the one for ICE.
This stock showed a lot of A+ setups across the board. But that doesn’t always mean it’s a great trade.
This is what the daily chart looked like.
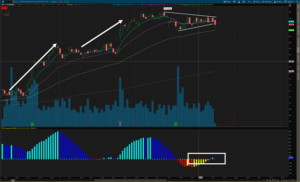
By all accounts, this looks like a decent setup.
However, if you zoom in on the moving averages, you’ll see that although they’re stacked, there isn’t a lot of space between them.
This setup met all the requirements and even had positive momentum on the squeeze shown at the bottom.
But this wasn’t my favorite setup that I came across.
Nonetheless, that didn’t mean I couldn’t or wouldn’t play it.
However, given the uncertain market outlook and my analysis of this setup, I took a much smaller position size than I typically would.
I don’t have a problem pressing my hand when things are going well, especially on a high quality setup on a fantastic stock.
However, even though the setup was good, it wasn’t great. Plus, ICE isn’t a popular stock and the options aren’t especially liquid.
When the risks increase, I decrease my size. It’s that simple.
However, there was one stock I came across that was too good to keep under wraps…
My Top Stock
Ever since Ozeimpic became popular, Eli Lilly (LLY) has been on fire.
As luck would have it, the company has earnings coming up on April 30th.
Over the years, I’ve noticed stocks will float up into earnings on a high quality stock that’s in an uptrend.
And as an added bonus, implied volatility for options that expire after the earnings date increases leading into earnings. That makes the price of those options more expensive as earnings approaches, which is great for option buyers.
When I checked the ticker on my SAM Ai Trading Tool, this is what I saw.

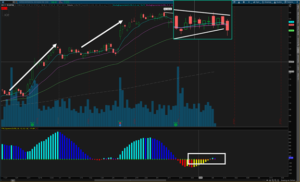
Pulling up a chart for LLY, this is what I saw:
Shares were making a beautiful consolidation pattern after a long climb higher.
At the bottom, I saw a squeeze forming with positive momentum.
Add the earnings catalyst to the mix, and I had all the trappings for a fantastic trade.
Now, these were the trades recommended by the SAM Ai Trading Tool:
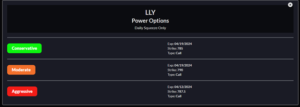
Although these are great choices, the options were a bit pricey for me.
So, I walked everyone through a special trade strategy that bet on a run towards $800 by earnings.
Since this setup was a bit more involved, I’ll save the walkthrough for a future newsletter.
Final Thoughts
Even though I keep my strategy simple, I can still find dozens of opportunities in the market every day.
Today I’ve shown you not only how I approach the markets, but how I identify and manage trades using tools like the SAM Ai Trading Tool.
Yet, this scratches the surface of what’s possible.
With DAILY LIVE sessions, training videos, and plenty of interaction, you won’t find a better place to take your trading to the next level than in DAILY PROFITS LIVE.
Do yourself a favor and CLICK HERE to take a test drive and see how far you can go.
More from Trade of the Day

Gold Just Went on Sale – But the Reason Won’t Last
Jul 17, 2026
The Market Feels Different. Here’s What To Watch.
Jul 16, 2026
Saddle Up Sally! The Hottest Trend in Retail
Jul 15, 2026