Introducing the “Next Major American Index”

When the Dow Jones Industrial Average was created in 1885 (which was well before computers and the internet), the only way to calculate a market indicator was to add up its components’ share prices and divide by the number of components.
So that’s exactly what Charles Dow did – and it’s still how the Dow Jones Industrial Average is calculated to this day.
Fast-forward 72 years…
When the S&P 500 was launched in 1957, technology had advanced to the point that Standard & Poor’s could base its new market metric on companies’ total stock market values – rather than on their share prices.
But even that methodology has flaws…
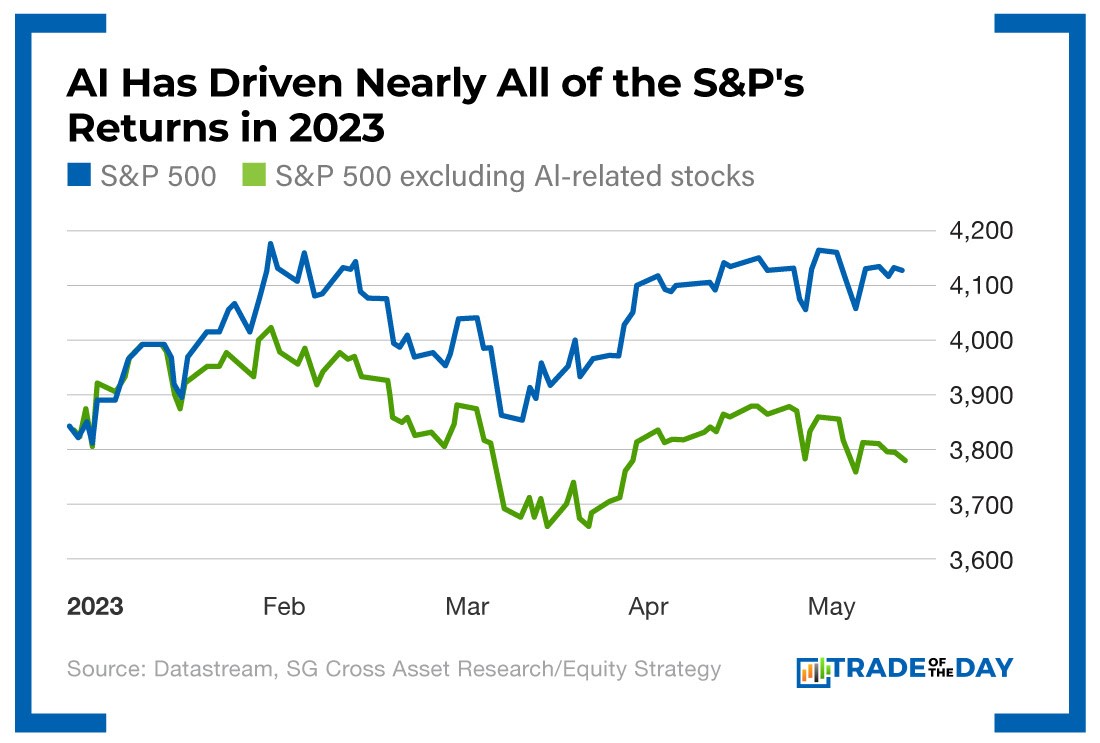
For instance, in the first quarter of 2023, just seven stocks supported the entire S&P 500…
Apple, Microsoft, Alphabet, Amazon, Nvidia, Meta and Tesla combined for 82% of the S&P 500’s return in the first quarter.
Check out the chart below, and you’ll see what I mean… Excluding the returns from artificial intelligence-related stocks, the market’s return has been negative in 2023.
The Big Takeaway
The way that the major market averages are constructed is both outdated and flawed…
That’s precisely why you’ll soon see my newest pick become the “Next Major American Index.”
As you’ll see below…
There’s a new asset now available for trading that I believe will be the “Next Major American Index”…
Simply because it does something quite remarkable…
It’s designed to automatically buy stocks during the time frame when they’re proven to go up…
And reduce your exposure to stocks when they’re proven to go down.
I call this time frame…
I discovered this when a lead researcher on my team slapped a recently “leaked” Federal Reserve report on my desk. This report was released with no major media coverage – probably for two reasons:
- It’s 90-plus pages: You’d need a strong financial background to decipher the key takeaways.
- It exposes a hidden market anomaly: It reveals a specific time each day that you want to be invested in the markets – which will embarrass almost every “buy and hold” fund manager in the world.
What could this mean for you?
Consider this eye-popping comparison….
Over the last eight years, $100 invested in Stock A WITH the Secret Profit Window…
Would have exploded up to $1.4 million.
But on the other hand…
Stock A (the same stock) WITHOUT the Secret Profit Window…
Was down 99.8%.
How can this be?
I’ll reveal everything to you in my urgent investor presentation.
![]()
YOUR ACTION PLAN
Decades of verified data show the exact time you should have been trading to get +1,700% returns over the last 30 years. Don’t put another $1 in the market until you know this Secret Profit Window.
Yes! Show Me the “Next Major American Index,” Featuring the Secret Profit Window.
More from Trade of the Day

Gold Just Went on Sale – But the Reason Won’t Last
Jul 17, 2026
The Market Feels Different. Here’s What To Watch.
Jul 16, 2026

Saddle Up Sally! The Hottest Trend in Retail
Jul 15, 2026