One Earnings Print Buried Two Years Of Bear Arguments
For two years, the bear case on Amazon was simple.
AWS was decelerating. The cloud business that drives most of Amazon’s profit had slowed to growth rates that did not match the price the market was paying for the stock.
Meanwhile, Amazon was pouring $200 billion into AI infrastructure that nobody could prove would generate a return.
That was the story. And the chart agreed with it.
Amazon traded sideways and lower from late 2025 through early April of this year, while the rest of mega-cap tech kept running.
Then April 29 happened.
Amazon reported the strongest AWS growth quarter in 15 quarters. The cloud business grew 28% year over year to $37.6 billion. Total revenue grew 17% to $181.5 billion. Earnings came in at $2.78 per share, beating expectations of $1.64 by 69%. Operating income jumped 30%.
Management guided the next quarter to a range that implies the acceleration is not finished.
In one print, the bear case got buried.
AWS reaccelerated to its fastest growth in three years. The AI capex finally started showing up in the revenue, and retail margins hit a record. Even the Anthropic investment, which I have a soft spot for, threw off $16.8 billion in pre-tax gains.
The chart turned the same day.
What the Chart Is Doing Now
Pull up a daily chart of Amazon. Three things jump out.
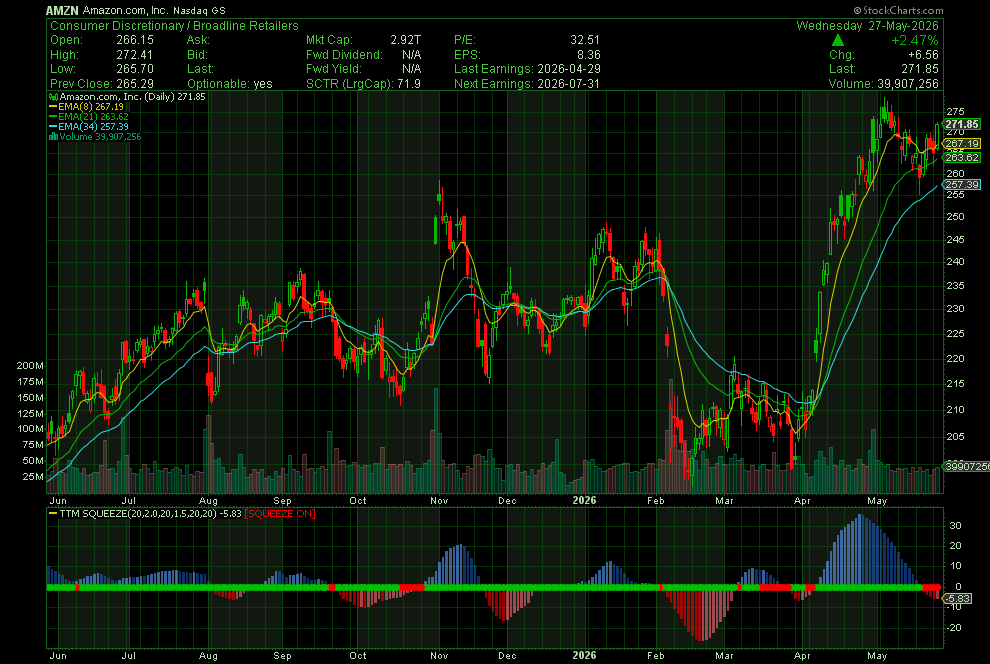
First, the moving averages are stacked.
A moving average is just the average price over a set number of days. The 8-period EMA averages the last 8 days, the 21-period EMA averages the last 21 days, and so on. When the shorter average sits above the longer one, recent prices are higher than older prices, which is the basic definition of an uptrend.
“Stacked” means that all three averages are in order from shortest to longest, with the current price above them all.
That arrangement tells you the same trend has been working at every time scale — buyers in control for days, for weeks, and for months.
It is the cleanest bullish trend signature you can put on a chart.
Amazon has this stacked alignment on both the daily and weekly charts.
Stacked on the daily is good. Stacking the weekly is much harder to set up and much harder to flip once it does, because the weekly chart only prints one bar per week.
When you see the trend stacked on both timeframes at the same time, you are looking at the strength the market has spent months confirming.
Second, the squeeze is on.
A squeeze occurs when a stock’s price stops swinging widely and starts trading in a tighter and tighter range. The Bollinger Bands, which measure volatility, get pulled inside the Keltner Channels, which measure average true range. When that compression happens, the indicator I use puts a red dot on the chart and labels it “SQUEEZE ON.”
This matters because of volatility cycles. Tight ranges always resolve in big moves. The longer the squeeze, the bigger the eventual move tends to be.
When the squeeze finally releases on a chart with this much stacked trend behind it, the move tends to be the kind you do not want to be sitting on the sidelines for.
Third, the calendar is clean.
Amazon already reported. The next earnings are not until July 31st. That gives the setup a full two months of runway with no scheduled catalyst risk to fight against.
Earnings are the single biggest source of overnight gap risk in any name, and right now Amazon has none in sight.
Your Action Plan
The technicals would matter on their own. But the technicals lining up exactly when the fundamental story flipped is what makes this one different.
The market has spent two years pricing Amazon as a company with a slowing cloud business and an expensive AI bet.
On April 29, both of those concerns flipped at the same time. The chart is what the market does next when a story like that changes.
Will it work? I do not know.
The market has the final word on every trade. But from a technical perspective, this chart has literally everything I am looking for, and that is exactly why it is sitting at the top of my list this week.
If you want to know how I actually trade setups like this, including the strikes I buy, the expirations I choose, when I scale in, and when I take profits, that is what we do every day inside Daily Profits Live.
Yesterday, in the Daily Profits Live room, I bought NBIS June 5 $250 calls for $2.42. I’ll be peeling those off this morning for a nice profit.
If you want to know what else I’m trading, click here.
More from Wake-up Watchlist

Healthcare Is No Longer Dead Money.
Jul 23, 2026

3 Stocks At All-Time Highs Just Got Downgraded
Jul 22, 2026