The Best AI Stock Software Already Exists

I started my career trading stock options on the floor of the Chicago Board Options Exchange (CBOE).
I was mentored by one of the country’s top floor traders in the heart of the technology boom from 1999 to 2000 – trading in the crowded and lively Apple Computer pit.
By executing trades in real time, I learned to identify and implement some of his most powerful trading secrets… secrets that rarely make their way outside the CBOE to individual traders.
Today, I’d like to share one of those secrets with you. It’s my top strategy to trade in any market.
I’ll illustrate the secret using a company called Teladoc Health (TDOC).
TDOC provides telehealth services (that is, virtual healthcare) in 100 countries across 450 medical subspecialties, such as flu and upper respiratory infections, cancer, and congestive heart failure.
In fact, TDOC is currently the global leader in virtual healthcare.
Post-pandemic, the company finds itself in a strong growth sector.
But guess what…
What TDOC does isn’t really that important.
You see, when it comes to the trading secret – which has contributed to our red-hot start to 2023 in The War Room – shares of TDOC have been responding extremely well to what I call “W” and “M” patterns.
If you can master these two simple patterns, you could accelerate your portfolio significantly.
Let me show you exactly what I mean…
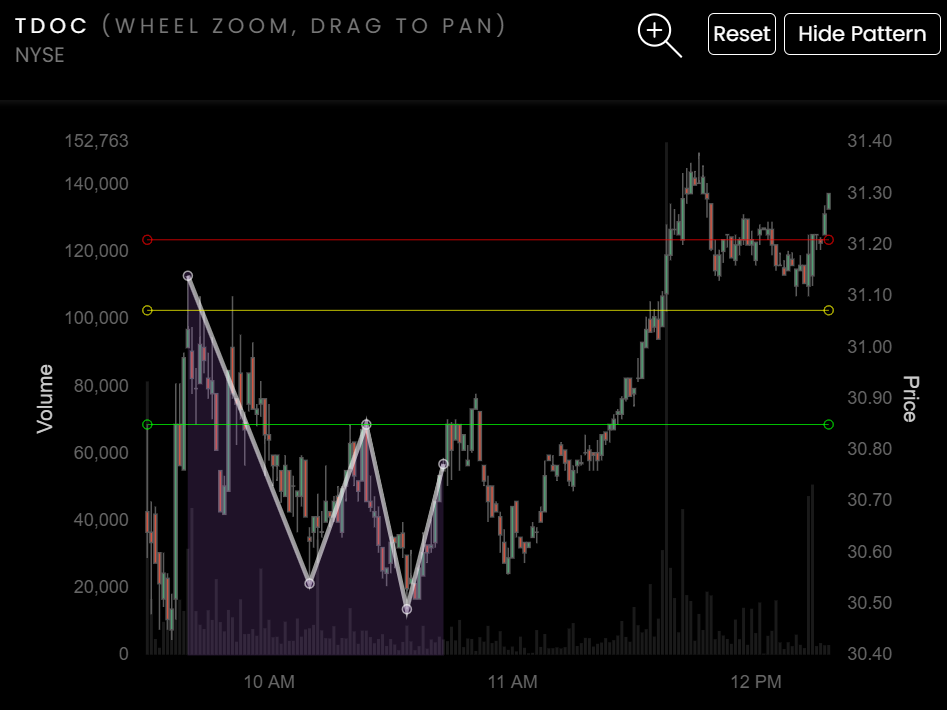
On Tuesday, February 7, at 10:45 a.m., my proprietary strategy alerted me that a “W” pattern had formed on TDOC.
It looked exactly like this…
 (Click to enlarge)
In short, a “W” pattern is a bullish setup.
You can see the beginning of a “W” outlined in white in the TDOC chart above.
According to my methodology, the moment TDOC moved above the green line at $30.85, we had confirmation that the “W” pattern had triggered.
When this trigger happens, you know – with a very high degree of confidence – that the stock could be ready to move higher.
And as you can see, that’s precisely what happened.
Less than an hour later, TDOC was approaching our predetermined upside target at $31.20, which is marked by the red line in the chart.
Simply following this “W” pattern could’ve resulted in one of the quickest – and easiest – winning trades you’ll ever see.
And quick winning trades are cool…
But this is only half the story.
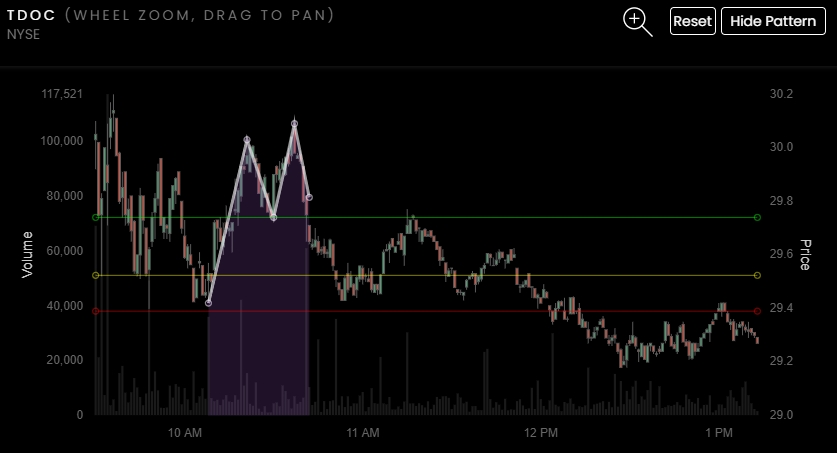
You see, just three days later, on Friday, February 10, at 10:50 a.m., my proprietary strategy alerted me that an “M” pattern had formed on TDOC.
In short, an “M” pattern is the exact opposite of a “W” pattern.
Instead of showing a bullish setup, an “M” trigger gives us a very high degree of confidence that the stock is likely to move lower.
Once again, you can see the beginning of the pattern – this time an “M” instead of a “W” – outlined in white in the TDOC chart below:
 (Click to enlarge)
In this case, my system helped me predict that TDOC would move from the green line at $29.75 down to the red line at $29.40.
And, as you can see, that’s precisely what happened.
Spot. On. The. Money.
Simply following this “M” pattern could’ve resulted in one of the quickest – and easiest – winning trades you’ll ever see.
Think this was just a fluke?
Or maybe a stroke of dumb luck?
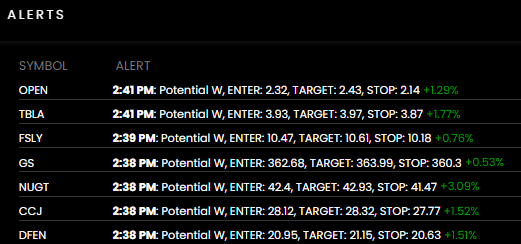
Well, check out how well this strategy worked on one of the most active days in the market… the day of a Federal Open Market Committee (FOMC) meeting, aka “Fed Day.”
As traders digested Fed Chair Jerome Powell’s comments after the FOMC meeting on February 1, the markets started jumping all over the place.
My system helped me identify the tickers that had short-term bullish momentum, and seven “W” patterns instantly triggered at around 2:38 p.m. As you can see below, all seven patterns led to winners. We had a sea of green on our trading screen…
And imagine if you could trade these signals… the instant they trigger.
You’d clean up.
You could trade TDOC – or any other ticker you like – up and down and consistently target gains.
And guess what…
Our members are using these signals to make top winning trades of their own.
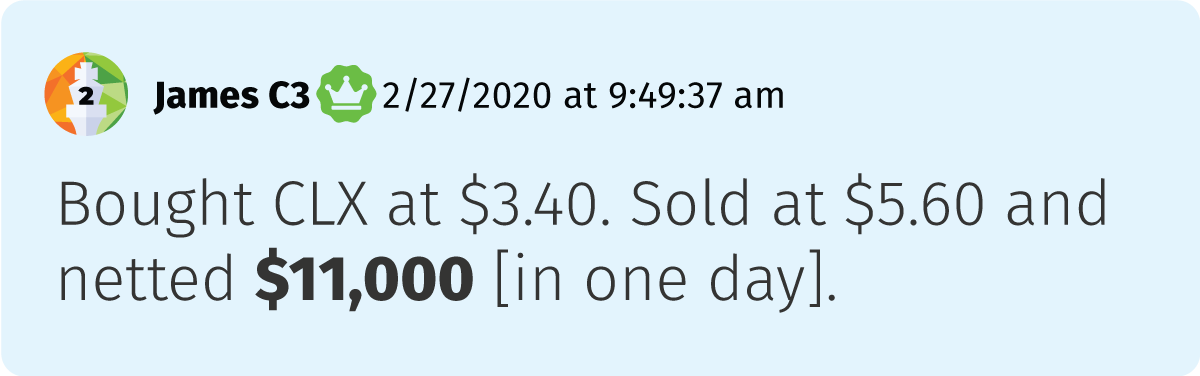
Like James. He made $11,000 when Clorox (CLX) jumped from $3.40 to $5.60 in about one day…
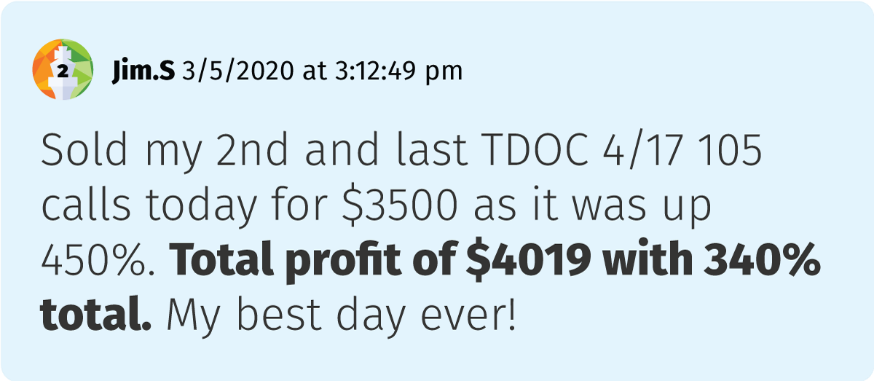
Or how about my student Jim?
I recommended a play on Teladoc that led to a 340% gain for him. He made $4,019 on one trade, his best same-day gain ever… in the middle of a total market meltdown!
And please… make sure you look at the dates of those member notes…
James’ note is dated February 27, 2020…
Jim’s note is dated March 5, 2020…
Both of these trades took place right before or during the COVID Crash!
This proves that these “W” and “M” patterns can work even in the WORST MARKETS.
![]()
YOUR ACTION PLAN
While these “W” and “M” patterns are powerful, there is one limitation to trading them.
You see… as a human being… you can trade only so many stocks in a day.
However, there’s a new trading technology that’s been in the making for over 20 years.
And for the first time ever… we’re going to show you a live demonstration so you can see exactly how it works… for FREE.
Click here to sign up for the FREE live event on Wednesday, August 2, at 2 p.m. ET.
More from Trade of the Day

Gold Just Went on Sale – But the Reason Won’t Last
Jul 17, 2026
The Market Feels Different. Here’s What To Watch.
Jul 16, 2026

Saddle Up Sally! The Hottest Trend in Retail
Jul 15, 2026