The Busy Person’s Guide to Trading

I have something special to share with you today. This is the system that changed my life.
I call it the “TPS system.”
It helps traders clear two major hurdles they often face when they’re starting out.
First, it’s simple.
I’m a busy man with a wife, kids, parrots, frogs and dogs. I don’t want to spend hours combing through charts or obsessively refreshing my browser to see how my trades are doing.
Second, this system identifies the trades I want to make… regardless of what the market is doing. I can find trade setups I like in up, down and sideways markets.
And I named it “TPS” because of the three components you need to identify.
I’m going to show you exactly how it works using visual examples below. Let’s dive into the first letter.
The “T” in TPS: Trend
The first letter stands for “trend.”
When you’re looking at a stock chart, you want to see consistent data pointing in one direction. It can be either direction – what’s important is that the trade goes in the same direction as the money flow.
You’ll see this in the example below for SunPower (SPWR).
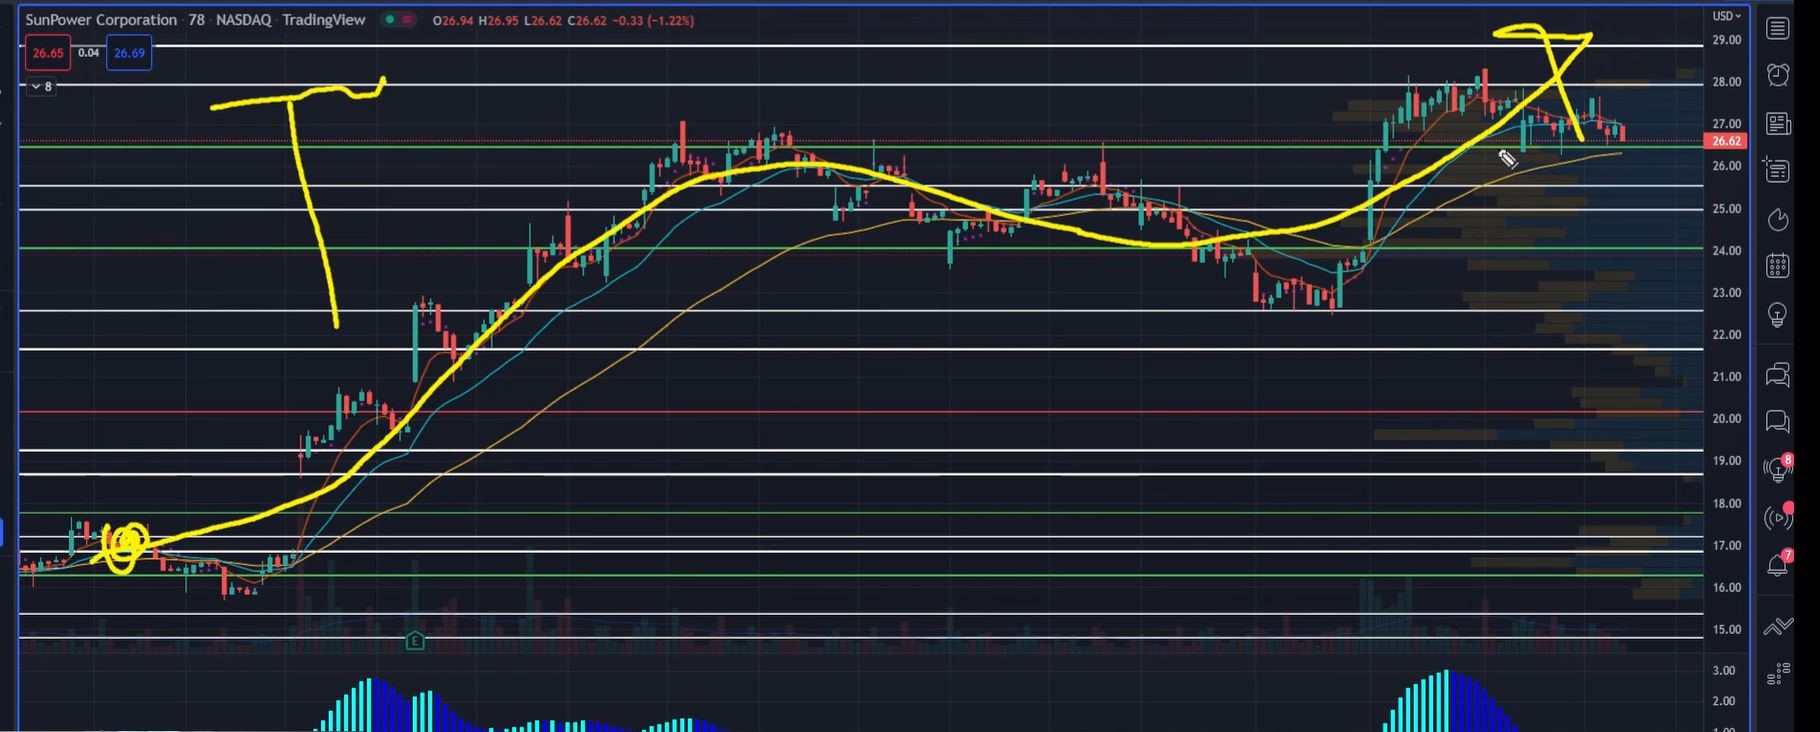
Notice the upward direction? That means money is flowing into the stock.
When I make a trade, I want to ride with the tide of money flow.
Beginner traders often try to predict when a stock will “hit bottom” or “break out to the upside.” This is usually a mistake.
Why? Because there’s no clear trend. Maybe they heard some speculative hot take on a finance website or news channel… but it was just speculation.
And I know from experience that trying to predict a stock’s direction without a clear trend is a losing game.
So before you even think about making a trade using this system, it’s crucial to identify a trend like the one you see above.
The “P” in TPS: Pattern
Next, you need a clear pattern.
Why look for a pattern? Once you’ve seen a particular pattern enough times, you have a good idea of how a stock is going to behave after it appears.
This gives you the opportunity to grow more confident in your trades.
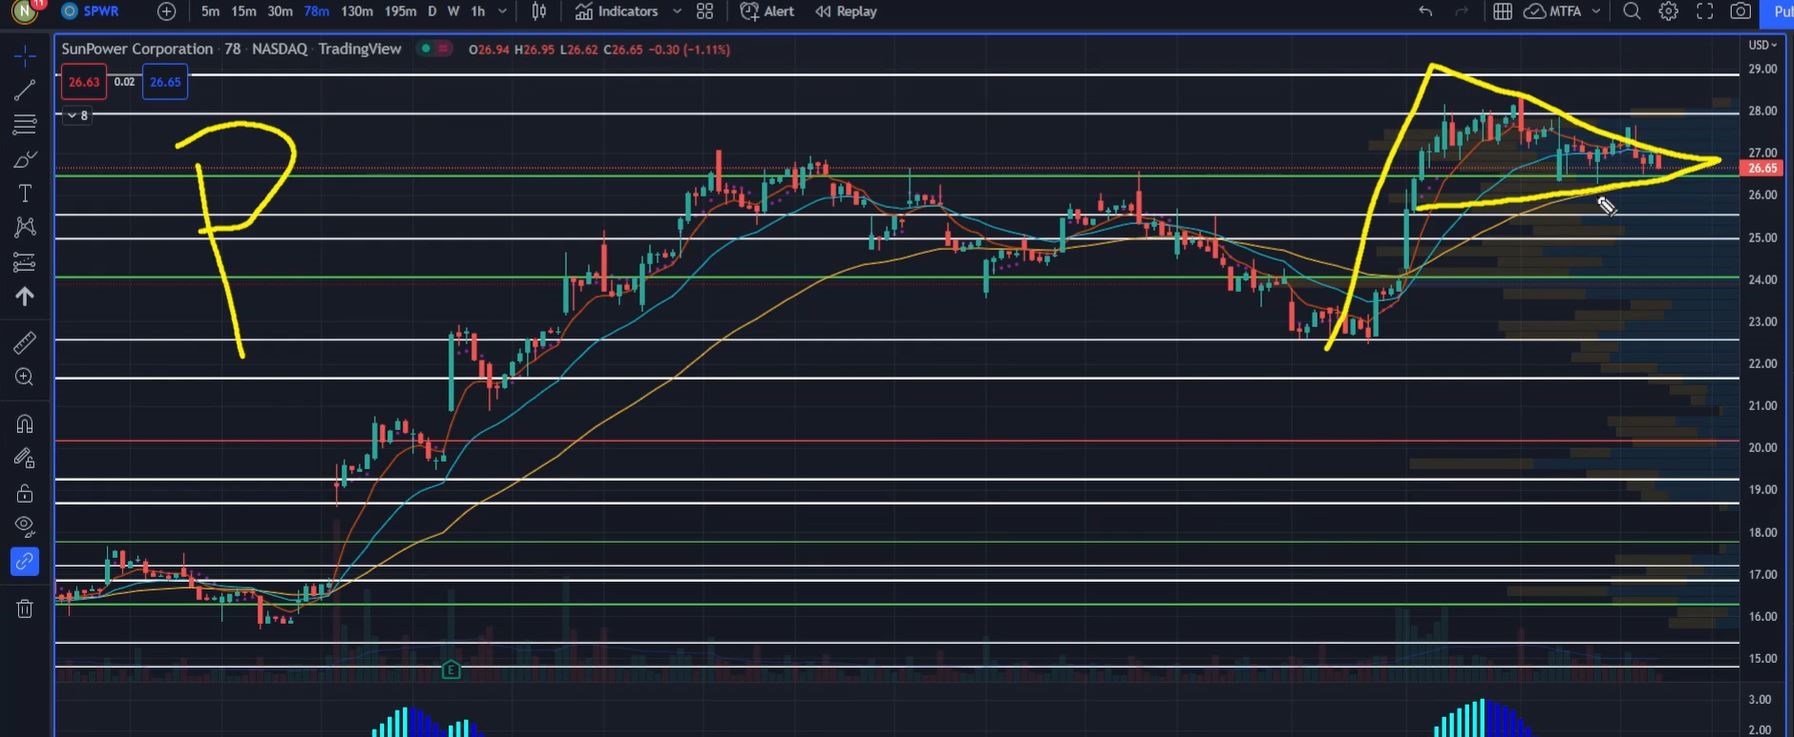
Case in point… In the chart below, you’ll see a flag pattern on the right.
For those of you who haven’t traded before, this pattern is called a “pennant,” and it’s among the most consistent patterns you’ll see when doing chart analysis.
Other common patterns include a bearish flag, bullish flag and ascending or descending triangle.
If you don’t see a common pattern within a chart, then scrap the trade entirely. And a pattern is something that you should be able to see both quickly and clearly. If you have to spend more than five seconds looking for the pattern, there likely is no pattern!
However, if you notice a pattern you’ve seen before and you’re confident in how the stock will behave, then you have the second letter in the TPS system.
We’re almost there. Now let’s get to the final component.
The “S” in TPS: Squeeze
The last component in the TPS system is a squeeze. And no, I’m not talking about a short squeeze.
I’m talking about an indicator. Every chart I share with you is going to have this indicator at the bottom.
See below…
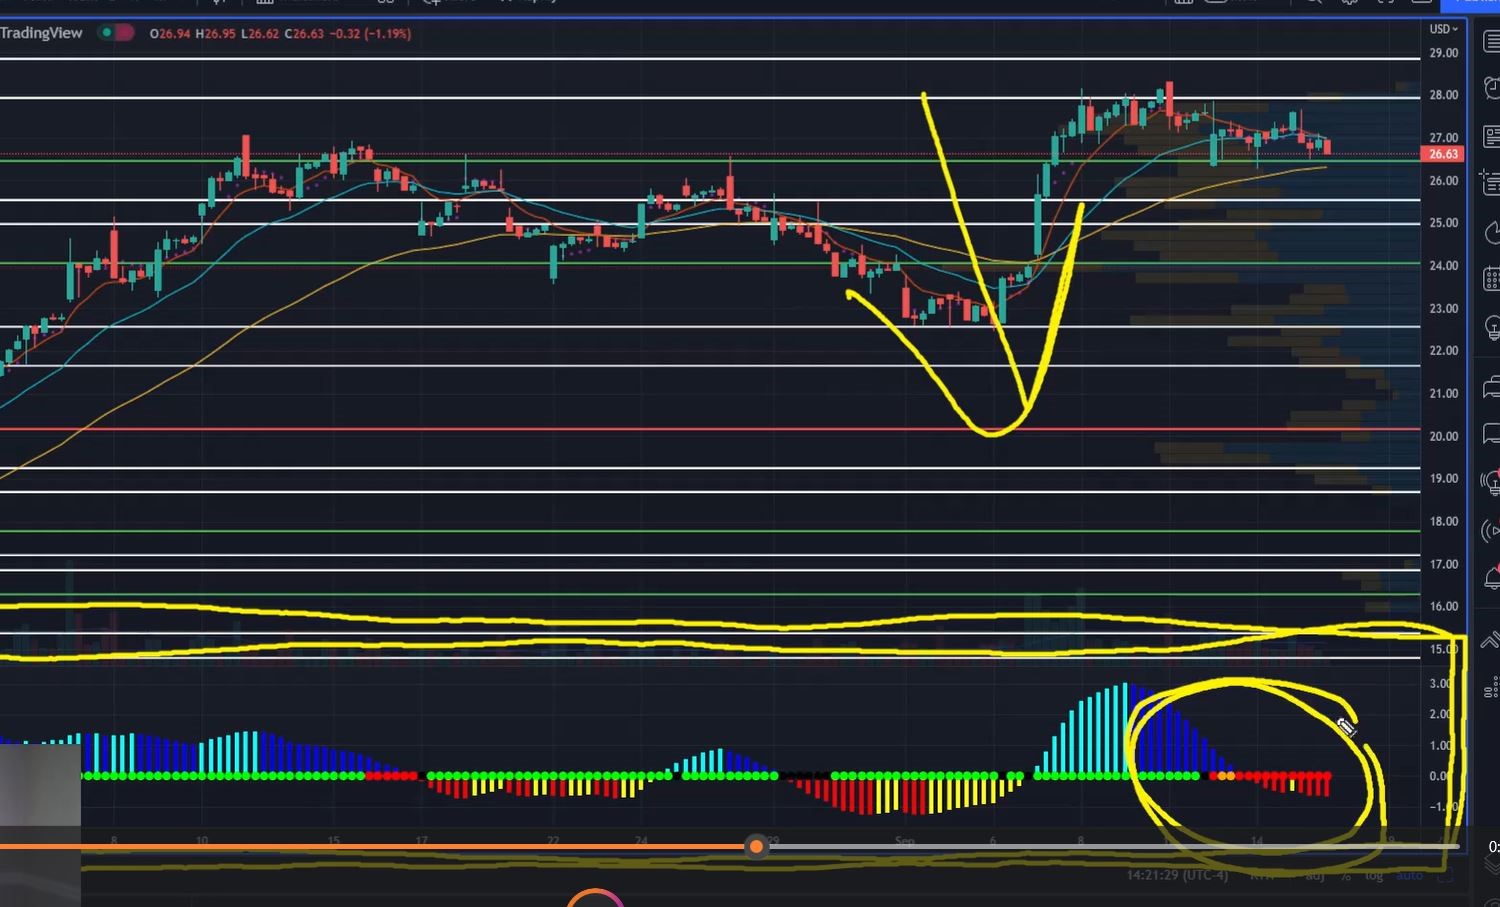
See that red area circled inside the rectangle? This is known as a “squeeze indicator.”
The truth is… every stock is like a long-distance runner.
The initial move up is like the first leg of the race. The stock is moving quickly in one direction.
It also has periods when it’s resting and showing more sideways action. This is when the red dots appear.
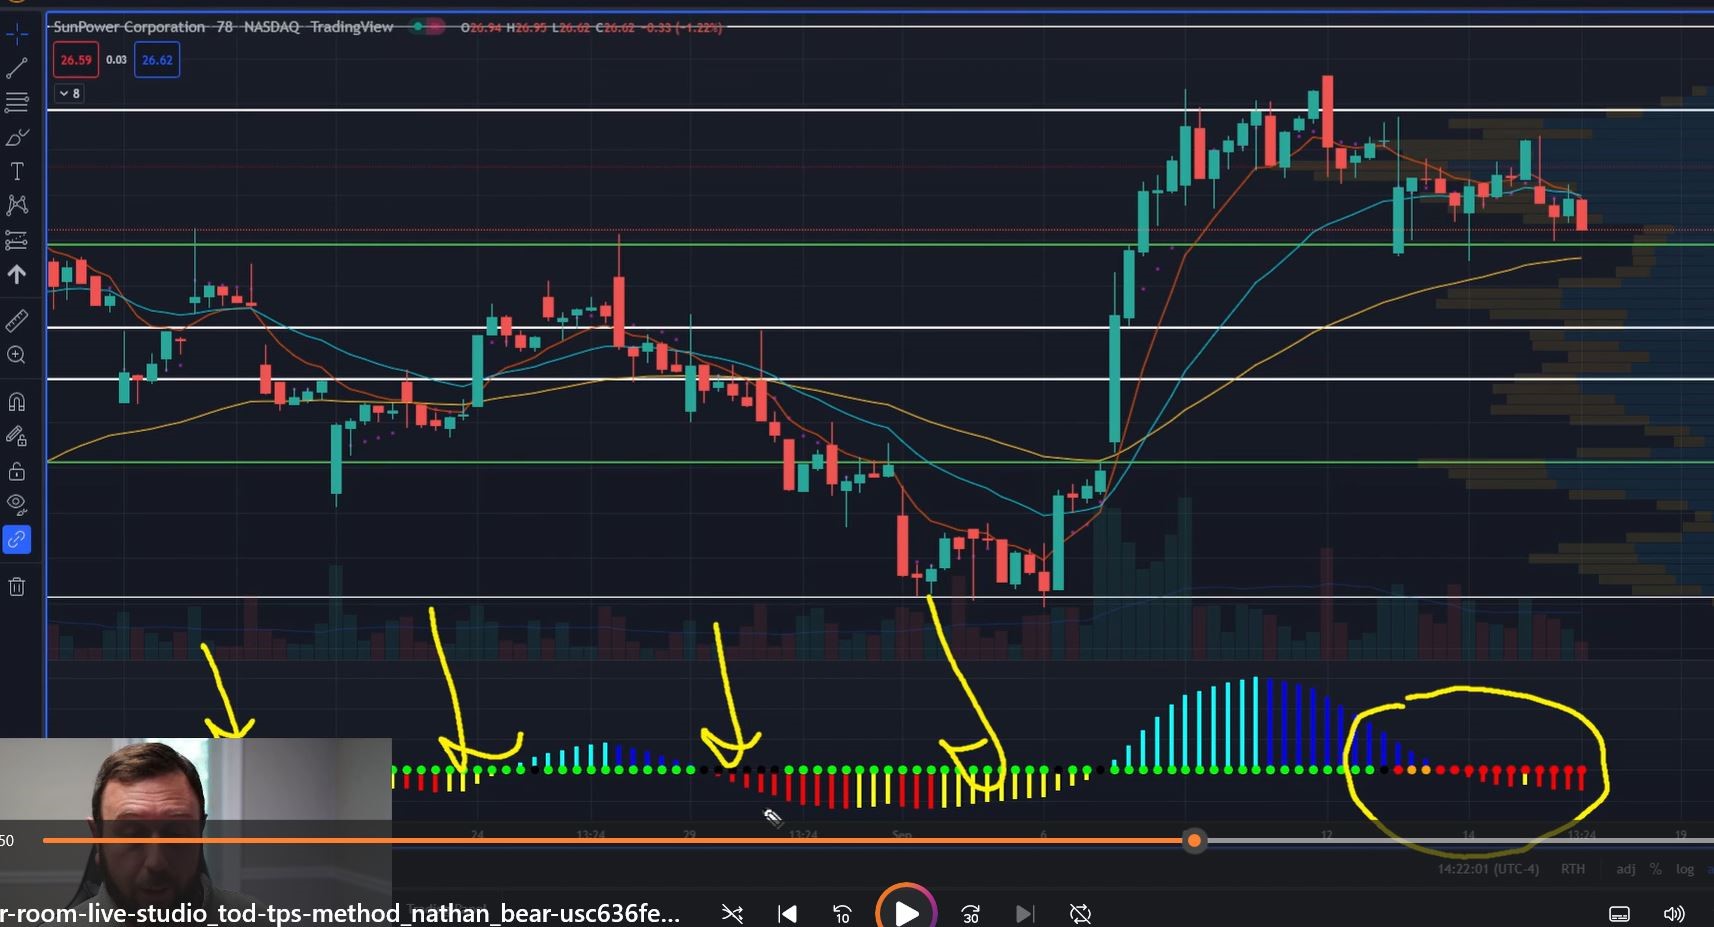
What we want to do is get into the stock during this “rest phase.” We do this because the rest period is when the volatility on the stock is compressing – and getting ready for the next “leg” of the race.
After you see a clear squeeze, you can be confident that the stock has had a chance to rest and is ready to continue along in the direction of the trend.
So when you see these red dots, you’ll know you have a squeeze.
Your TPS Checklist
Those are the three components of my TPS system. So next time you’re making a trade, follow this checklist.
First, do you have a trend?
If the chart is moving from the bottom left to the top right, it’s trending higher. If the chart is flowing from the top left to the bottom right, it’s also trending… but it’s trending lower. We can make money in both directions.
Next, do you have a big pattern? If you see a familiar pattern on the right side of the chart, then you’ve cleared the second step.
Lastly, do you have a squeeze? Do we have red dots on the squeeze indicator? If so, then boom. You have all three clear components for making a trade.
Below you’ll see an example of what all three green lights look like in one chart.
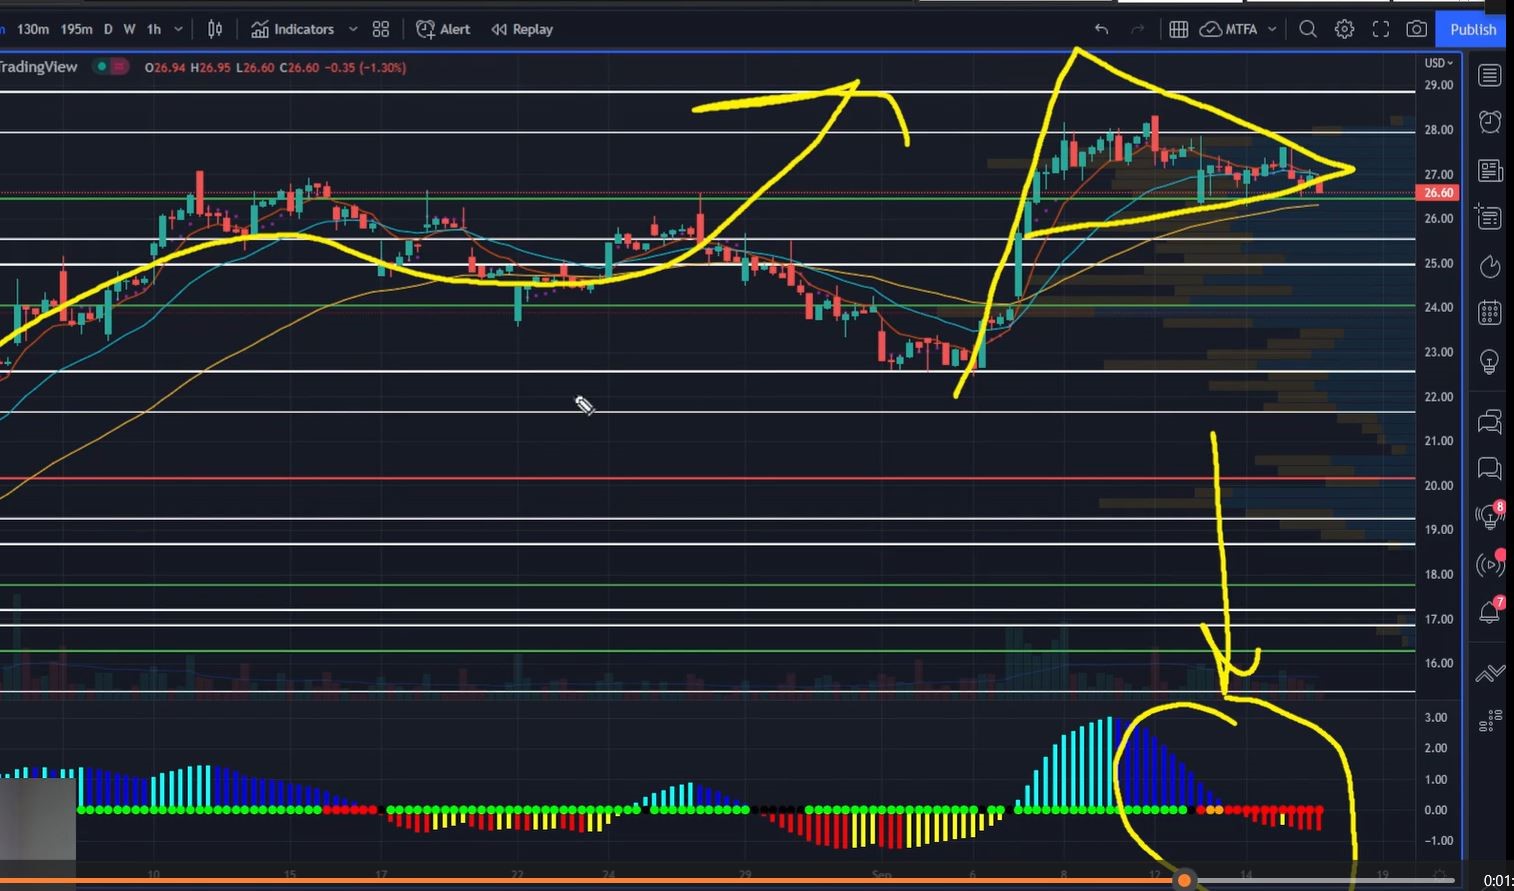
These are the three identifiers I use with every trade I make.
![]()
YOUR ACTION PLAN
This is the exact system I used to turn a $37,000 account into $2.7 million in verified trading profits in just four years. Right now I’m reopening the doors to my very first Open House for Daily Profits Live, and when you sign up, you’ll be able to follow along with my trading system LIVE… for FREE. You still have time to see this system in real time, so click the link below to join the chat room tomorrow.
Click here to sign up and start following my trades tomorrow. No credit card required.
P.S. Check out some of the results Open House attendees are getting below…
TESTIMONIAL TUESDAY
“FYI CRWD in $1.93 out $2.45 27% gain [in one trading day]. Thank you”
– Gunner
“CRWD 3 contracts in $1.10 out at $2.65 [for a 140% gain in one trading day]!”
– ManuelO
Click here to sign up for the Daily Profits Live Open House.
More from Trade of the Day

Gold Just Went on Sale – But the Reason Won’t Last
Jul 17, 2026
The Market Feels Different. Here’s What To Watch.
Jul 16, 2026

Saddle Up Sally! The Hottest Trend in Retail
Jul 15, 2026