The Sad Truth About Historic Market Up Days

Yesterday was the Dow’s best gain since 1993.
The blue chips rallied 11.37% yesterday – representing the fifth biggest percentage gain in its entire history.
And today the rally continued.
So the obvious question you’re asking…
Is this the bottom?
Or more pointedly, is it time to buy, buy, buy?
Well, sorry to throw cold water in your face, but here’s the truth…
If you look at the top four Dow gains of all time, you’ll notice that all of them came during the Dow plunge of 1929 to 1932, which is the time frame that carried us into the Great Depression.
The next two biggest single-day gains came during the 2008 meltdown.
So when you see the “biggest gains of all time” – those do not represent bottoms.
Quite the opposite, in fact…
The truth is those sorts of massive single-day moves confirm dead-cat bounces within a bear market – and history proves it.
To put it another way…
The crash of 1987 retested the lows.
The crash of 2008 retested the lows.
So is there any reason to think we’ll retest the lows again here in 2020?
Of course.
It’s very reasonable to think that we’ll soon be seeing another big drop. Perhaps the next downside trigger will come tomorrow, when the Department of Labor reports initial jobless claims for the week ending March 21.
Morgan Stanley thinks that weekly U.S. jobless claims will hit 3.4 million, which is a record.
But I think that number is still too low – and here’s my “back of a napkin” reasoning…
As a pure comparison, jobless claims in Canada closed in on 1 million – which represents 5% of its total workforce (this destroyed its weekly record, by the way).
As of January 28, 2020, the U.S. ranked as the third-most populous country in the world – with an estimated population of 329 million. If we mirror Canada, and we match the 5% total workforce of jobless claims, then we’re looking at more than 16 million jobs lost.
Will we hit this number? Who knows?
Will the Labor Department even report a truthful, accurate number? That’s another big question mark.
All I can say is… whatever the true number is, it’ll be very, very high.
And it could trigger the next pullback.
If that happens, here’s one way to play it lower: Shake Shack (NYSE: SHAK).
Why do I like shorting Shake Shack right now?
Well, look at Red Robin (Nasdaq: RRGB).
They’re both in the same industry. Burgers and fries.
Same exact market space.
Yet somehow, during the last pullback, Red Robin dropped 70% while Shake Shack fell only 40% over the same time frame.
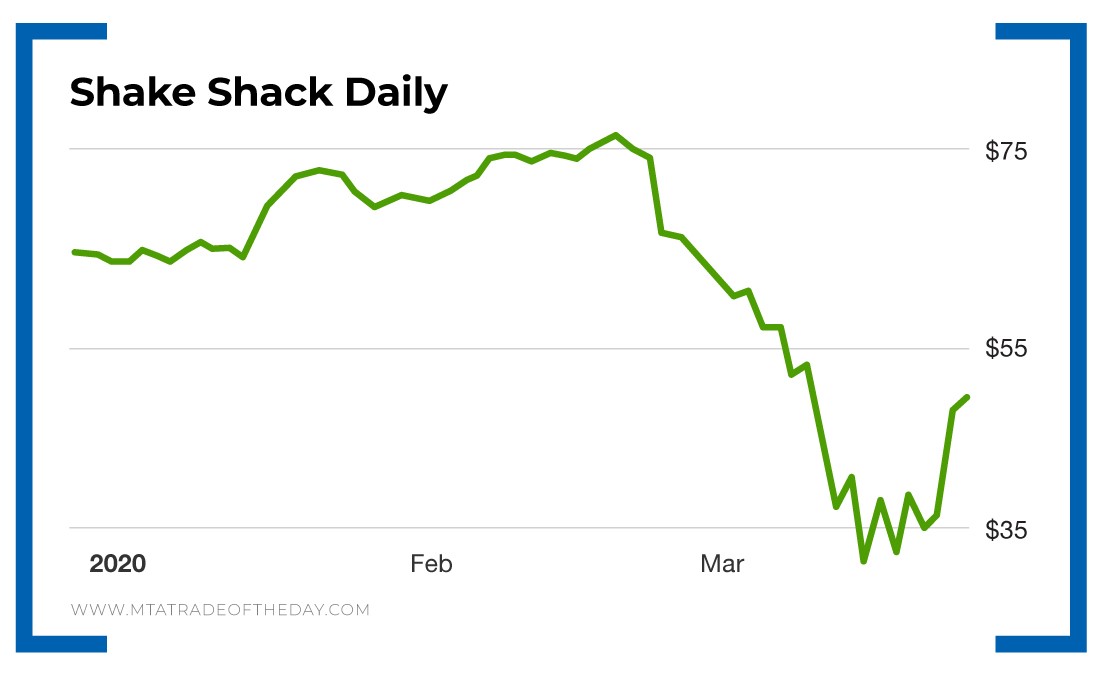
Action Plan: If the markets drop again, I think you’ll see a “catch-up effect” coming for Shake Shack. Using a pretty clear apples-to-apples comparison, if one burger joint just dropped 70% and another dropped only 40%, then one of those two is on borrowed time. I think we’ll see Shake Shack back below $35 very soon.
If you want to know how to play Shake Shack as it drops lower – and other bear market plays – I invite you to join me in The War Room today!