A Critical Tool for Improving Your Trading Results
Editor’s Note: Today, we are excited to share a guest article from a Pro Trader and coach in our real-time trading chatroom, The War Room.
Kirk Hill has amassed quite a following in our community by masterfully breaking down the trends of the S&P 500.
Countless times each week, his analysis and predictions come true. He and other members have been ringing the register as a result. No easy feat, especially in this market. It pays to pay attention to what Kirk has to say.
And below, he reveals an important technical tool you’ll want to add to your trading toolkit.
Ryan Fitzwater, Associate Publisher
Every trader is always looking for an edge – especially in bear-driven markets…
From those just starting their investing journeys…
To trading veterans with multiple decades of experience and millions of dollars in their brokerage accounts.
Any technique or advice that can improve your trading results is worth paying attention to.
Today, I want to share a versatile tool that can significantly boost your trading success.
The Power of Moving Averages
When traders are looking at a security’s price and trying to decide whether it is a good time to buy or sell, there are many things to consider.
One technical tool I like to use is moving averages. There are different types of moving averages that can help you make smart buy or sell decisions. Here are three that you can add to your trading toolkit today:
- The most popular type of moving average is the simple moving average. It is the average price of a security over a given period.
- Next, there is the exponential moving average. It gives more weight to recent prices and therefore reacts more quickly to changes in the price of a security.
- Lastly, there is the volume-weighted average price (VWAP). It considers not only the price of a security but also the volume traded over the specified time period. This can be helpful in determining whether there is buying or selling pressure on a particular security. VWAP can be used in conjunction with other indicators to help traders make informed investment decisions. And VWAPs can also be used to identify market trends.
Of the three moving averages above, I find VWAP the most useful for successfully timing my trades.
The Power of VWAP
Let’s dig into the details really quick…
The most common VWAP in use is the daily VWAP. It starts the averaging at the beginning of the trading day and continues to average the volume-weighted price throughout the day.
This daily VWAP can be plotted as a single line on the same chart as the current price for that security. Some traders prefer to add in the premarket volume-weighted prices when calculating the daily VWAP, whereas other traders start the averaging at the cash open for the day.
VWAPs can also be anchored to the start of prior trading days so that the trader can see longer-term volume-weighted averages.
For instance, a VWAP that is anchored at the start of the previous trading day is referred to as a two-day VWAP. One that is anchored at the start of the trading day two days prior to the current trading day is called a three-day VWAP.
The most common short-term VWAPs are the daily, two-day, three-day, four-day and five-day VWAPs. VWAPs can also be anchored over a much longer duration. For instance, a VWAP that starts the volume-weighted price averaging 30 days prior to the current trading day is called the 30-day VWAP. Some of the more common long-term VWAPs are the 30-day, 60-day, 90-day, 180-day and one-year VWAPs.
With the technical breakdown out of the way, here’s how you can start putting VWAPs to use…
The Ultimate Buy and Sell Signal
One way to use VWAP is to buy the security when the price crosses above the VWAP.
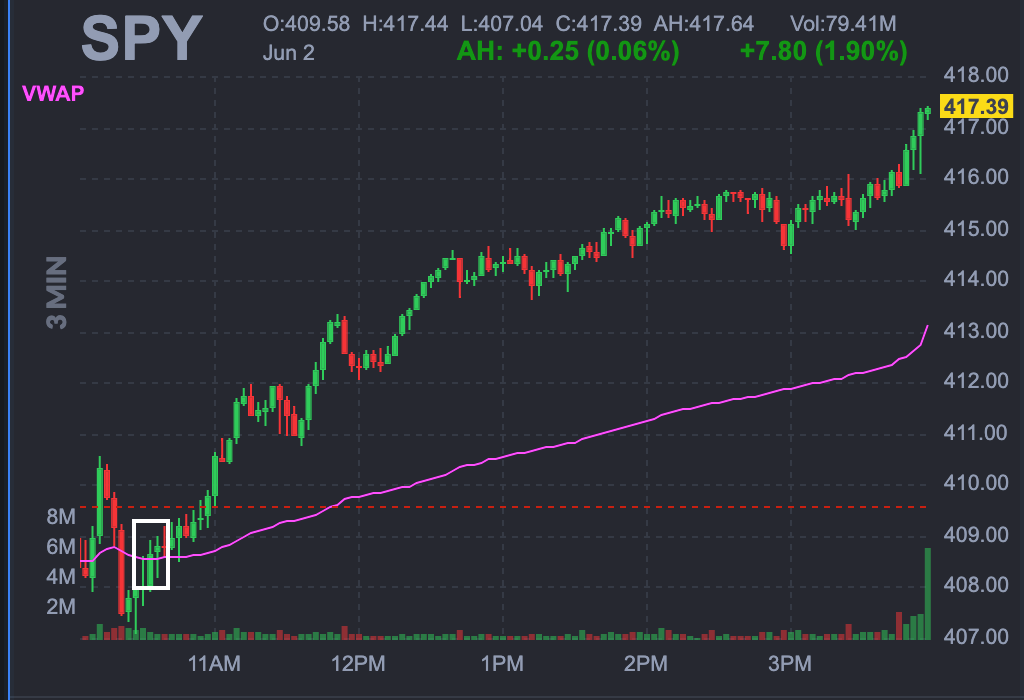
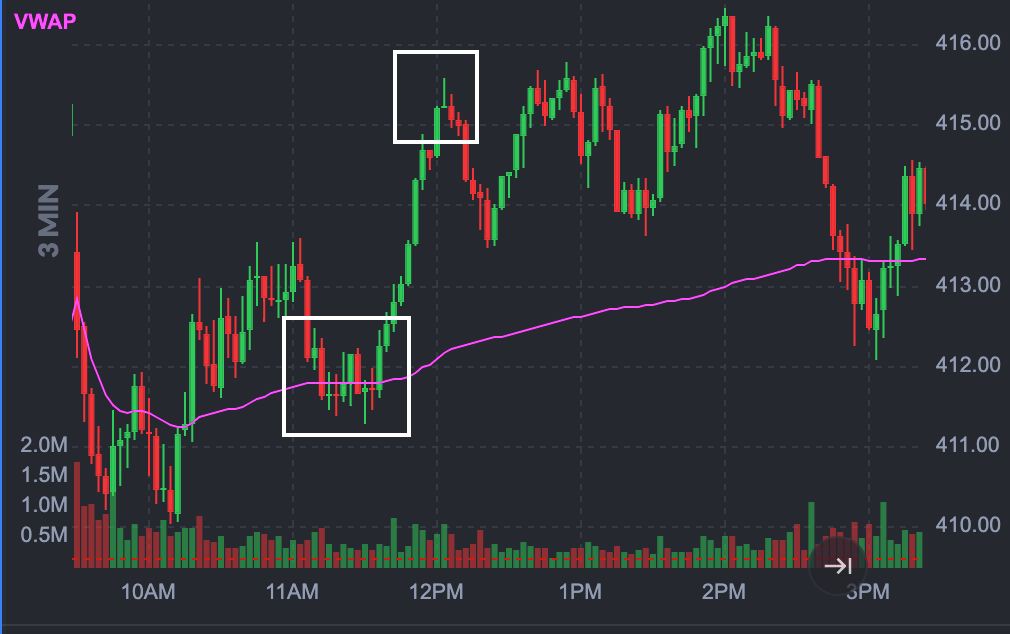
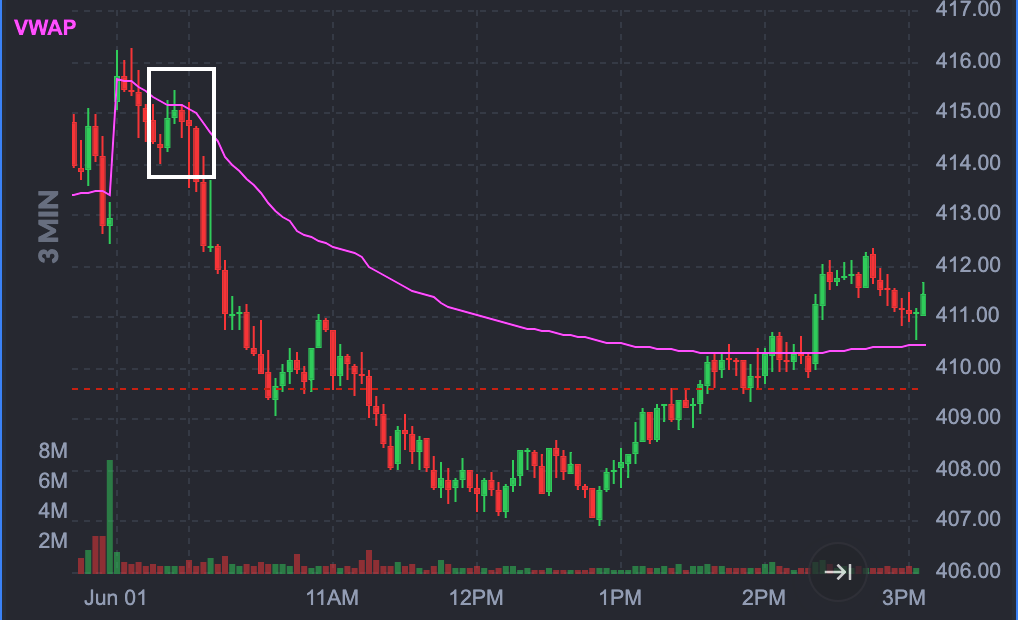
Or you can buy when the price comes down and bounces up off the VWAP – especially if the VWAP is generally trending up.
Another way to use VWAP is to sell the security when the price crosses below the VWAP.
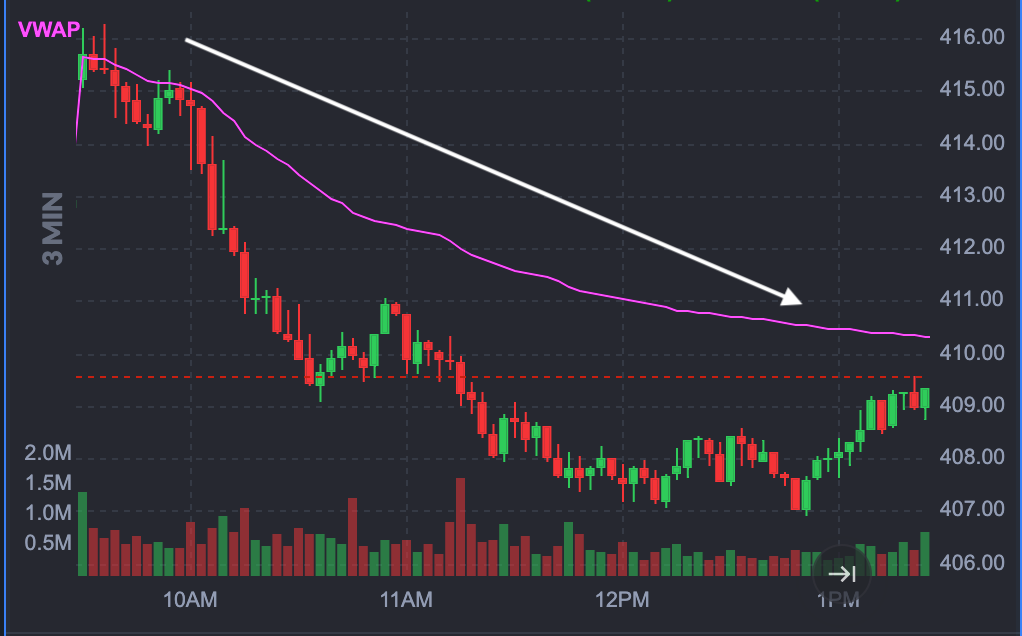
Or you can sell when the price comes up to reach the VWAP and reverses down after entering a narrow area around the VWAP – especially if the VWAP is trending down.
And here’s something cool…
If the VWAP is trending relatively flat, there are other trading opportunities. You can trade the security based on the price reverting back to the daily VWAP after moving away from the VWAP – as long as the VWAP stays relatively flat.
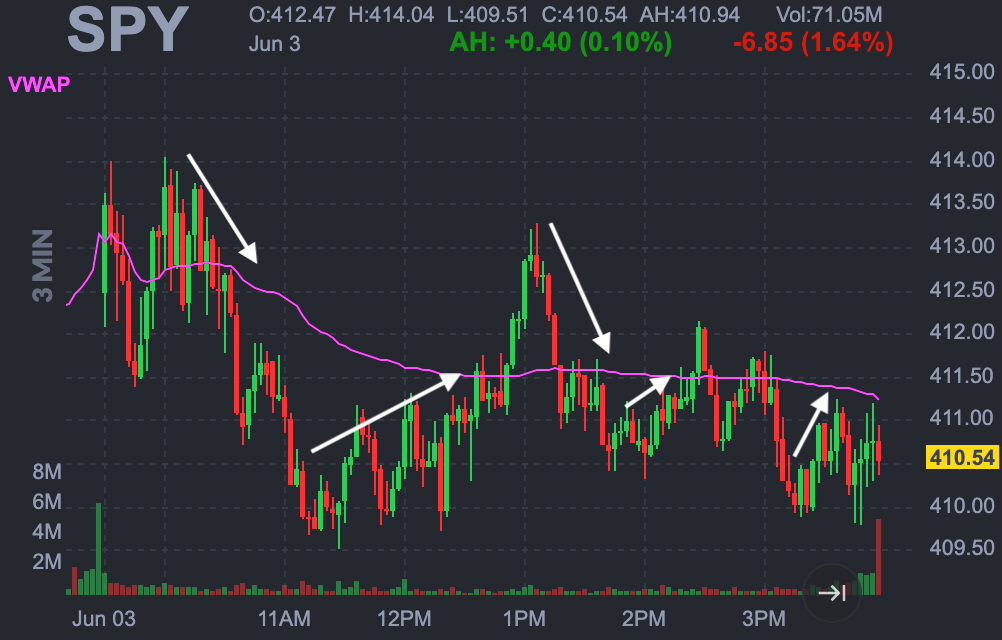
Not matter which type of VWAP you are using, it’s important to pay attention to the general direction it’s trending.
For instance, if a VWAP is trending higher, that tends to indicate that the underlying security has been in a bullish trend for that VWAP’s time frame.
If on the other hand a VWAP is trending down, that typically indicates that the security has been in a bearish trend for that VWAP’s time frame.
If some of the multiday VWAPs are trending up while others are trending down, that indicates that the security is likely going from either a bearish to a bullish setup or from a bullish to a bearish setup. It all depends on which VWAPs are trending up and which are trending down.
Action Plan: There are many ways to use VWAP to trade securities. It can be used as a trend indicator or to identify oversold and overbought conditions. Additionally, it can be used to confirm price movements and to generate trading signals. Ultimately, VWAP is a versatile tool that can be used to improve trading results.
And if you want to see how I trade using VWAP in real time, I invite you to join me in The War Room. Up your trading game today – and get 252 winners guaranteed over the next 12 months – by clicking here!
More from Trade of the Day

Forget The Chips, Watch The Power Grid
Jul 2, 2026
The AI Boom Has a Power Problem
Jul 1, 2026

CEO Steps Down = Insiders Immediately Buy
Jun 30, 2026

A Lesson From 1973 I Never Forgot
Jun 29, 2026