Will the Market Totally Crash? Watch This Video…

It’s no secret… The markets have been exceptionally volatile this week.
After a rip-roaring rally following the Fed meeting on Wednesday, the Dow Jones tanked 1,120 points on Thursday. And the Nasdaq Composite plunged 5.2%, marking its worst day since 2020.
But how fearful should we be?
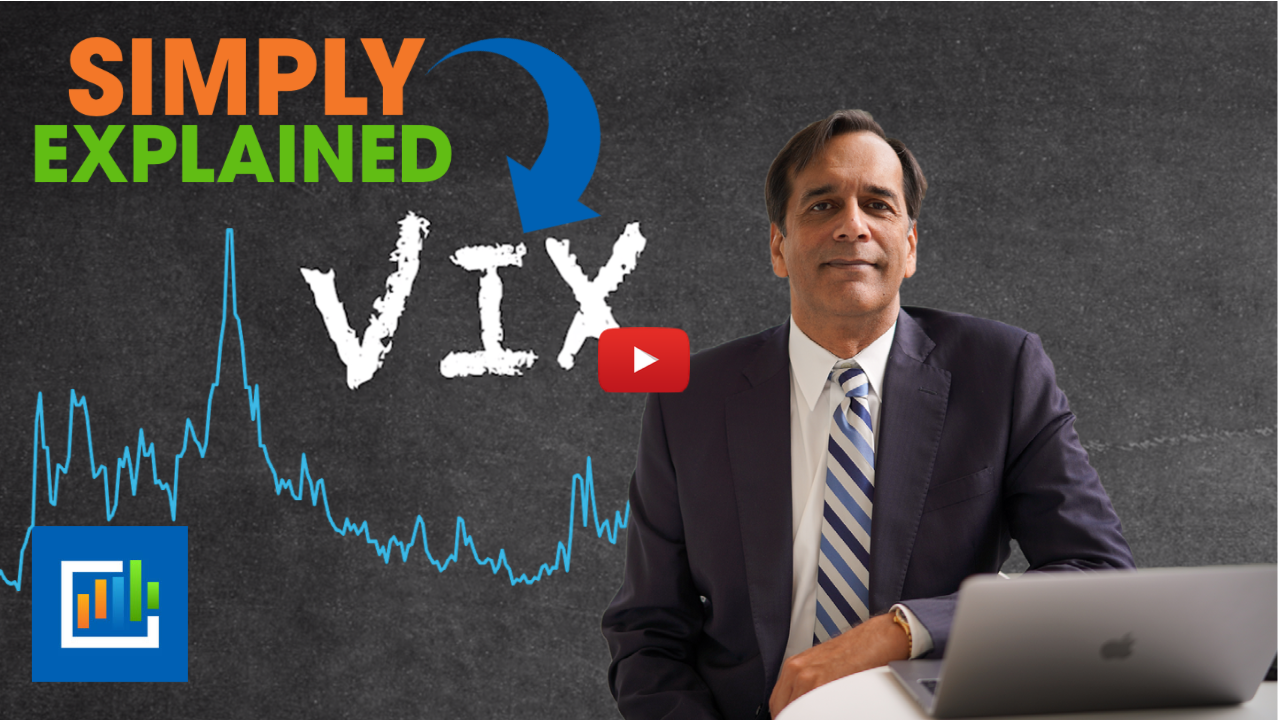
The answer lies in this key market measuring tool.
This is the most accurate indicator I’ve ever seen. And most people don’t even know it exists.
By the end of today’s video, you will know exactly how it works when it comes to predicting market volatility.
Watch the video below to discover this powerful indicator.
Action Plan: As we continue to navigate choppy markets, it’s important to not let fear get the best of us. That is why we’re excited to offer you a FREE one-week subscription to our highest-level trading service, The War Room. But you have to hurry and sign up for our Open House now. It starts next Monday, May 9, and it runs through Friday, May 13. We don’t offer these Open House opportunities very often, but they are the very best way to see for yourself what it’s like to be part of our War Room trading community – TOTALLY FREE. To lock in your free week of access, simply click below – and you’re in. Don’t miss it! Click here to join our War Room Open House.
Fun Fact Friday
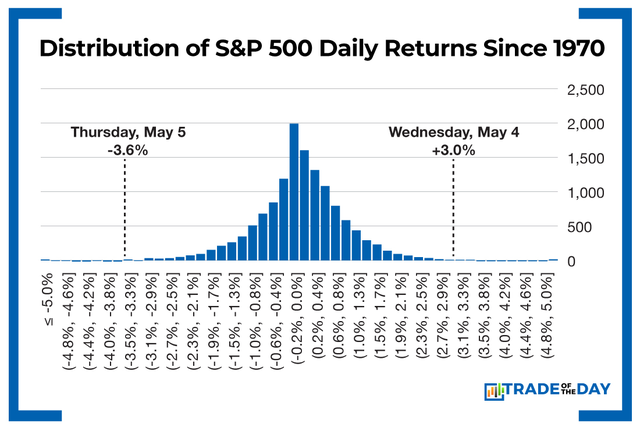
The market swings have been spectacular this week. This chart shows what the most common daily swings in the S&P 500 have been since 1970. Notice how small the candlesticks are on either side of the range from -3% to 2.9%. Yet the last two days have each fallen outside that range. Volatility remains the name of the game in 2022.
More from Trade of the Day

Forget The Chips, Watch The Power Grid
Jul 2, 2026
The AI Boom Has a Power Problem
Jul 1, 2026

CEO Steps Down = Insiders Immediately Buy
Jun 30, 2026

A Lesson From 1973 I Never Forgot
Jun 29, 2026