Can You Escape the Cape?

Some sectors of the market look cheap while others look frothy.
For example, this week we saw how quickly money can move from overvalued to undervalued as industrials and small caps outperformed the high flying tech sector.
Can this continue? Should this continue?
The truth is…
It certainly can continue.
Here’s why:
The current S&P 500 Shiller CAPE Ratio is 36.06. This represents a 2.48% increase from the previous month’s reading of 35.19 and a 3.60% increase from the same period last year.
What is the CAPE Ratio?
The CAPE ratio, also known as the Cyclically Adjusted Price-Earnings ratio, is a valuation metric that divides the S&P 500’s current price by the 10-year moving average of inflation-adjusted earnings.
Here’s an analogy to explain the CAPE…
The CAPE ratio is like checking the average weather over the past 10 years. It helps you see long-term patterns so you can decide if it’s actually a good time to plant.
Overall, the CAPE helps investors zoom out and ask “Are stocks cheap or expensive compared to the past 10 years of earnings? It’s not a timing tool, but it’s a strong signal for long-term valuation risk.
On the other hand, a regular P/E ratio is like checking today’s weather. It might be sunny, but that doesn’t tell you if it’s been raining for weeks or if a drought is coming.
Currently, most of the high p/e is being generated by the Mag 7 stocks, which are pushing the price weighted S&P 500 higher. That’s today’s weather.
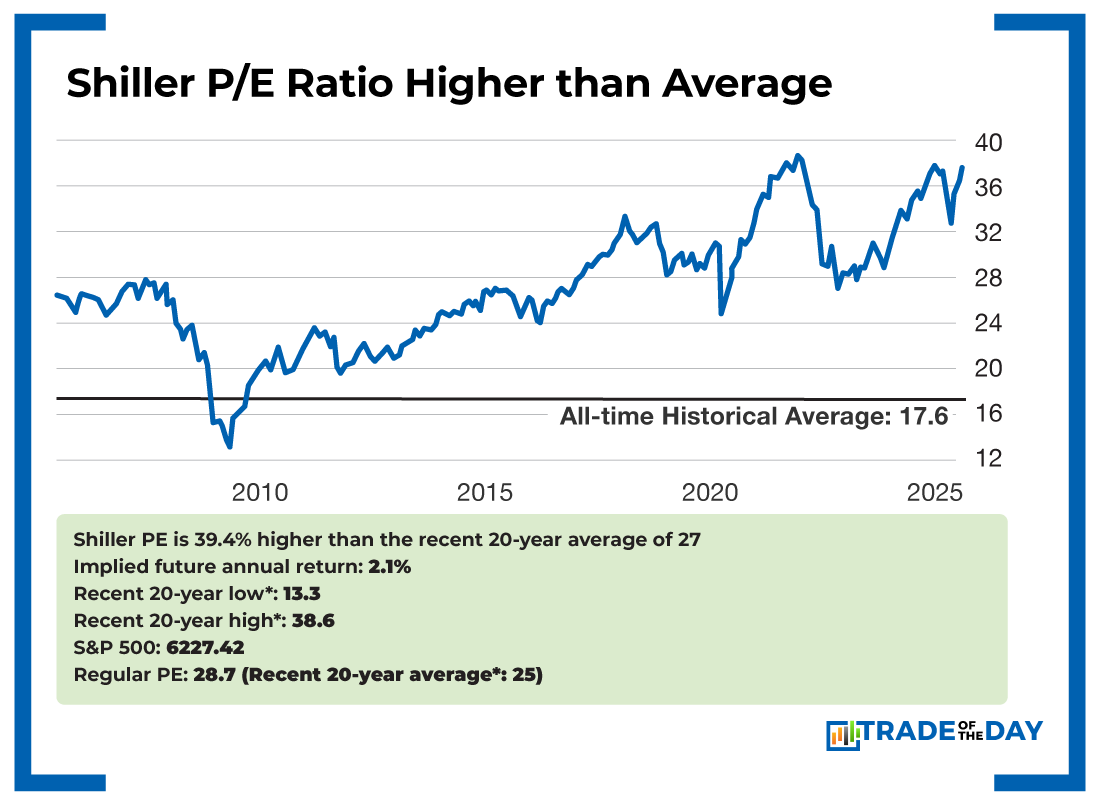
But the CAPE ratio is used to assess long-term stock market valuations and can be an indicator of potential future returns.
A higher CAPE ratio, like the current one, may suggest lower returns over the next couple of decades as the ratio reverts to the mean, while a lower CAPE ratio could indicate higher future returns.
As you’ll see in the chart below, the current Shiller P/E ratio is significantly higher than its historical average, indicating a potentially overvalued market.
But, while this is signaling tough times ahead for returns, the old Wall Street axiom that markets can remain irrational longer than you can remain solvent comes to mind.
![]()
YOUR ACTION PLAN
My advice is simple. Don’t sell everything. Position size and make sure you’re not overweight in the tech sector. And always look for value!
In terms of value plays, I have one particular stock I’ve been telling readers about in the energy sector. Of 23,281 publicly traded companies, it’s the only one that’s wildly profitable and insanely undervalued. It also recently struck a deal with a major artificial intelligence company, meaning there could be much more growth ahead.
Click here to discover what I believe could be the next “Unicorn” stock.