The Biggest Market Drops in History – Explained in Today’s Coronavirus Context

As I’m sure you know, U.S. stockholders lost $2.8 trillion in value last week – and $4.6 trillion since the February 19 high.
What we witnessed last week was truly history – something we’ll be talking about for decades to come.
Just this week, Barron’s said…
The black swan event Wall Street has long feared materialized with the coronavirus epidemic after an 11-year bull market.
In the midst of this carnage…
Only seven stocks in the entire S&P 500 went up last week:
- Gilead Sciences (a vaccine player)
- Regeneron Pharmaceuticals (another vaccine player)
- CME Group (an exchange play that thrives in volatile markets)
- Cboe Global Markets (another exchange play that thrives on volatile markets)
- Newmont (a gold stock)
- E-Trade (a news-driven takeover play)
- Clorox (my favorite).
If you recall, Clorox fell hard on Friday after Jim Cramer said to take profits and then buy the beaten-down tech company Nvidia.
But just this morning, I said…
I think this could be a great opportunity to reload Clorox.
In fact, all weekend, I was getting emails, texts and notes from people saying that Clorox products are selling like crazy.
ABC7 News released an article about this titled “Coronavirus concerns: South Bay Costco sells out of water, Clorox wipes.”
And this morning, we once again used my unique trading patterns to trade Clorox – and hit a quick and easy 30% winner.
Now, when it comes to the recent market trading, I’d like to take a look at the severity of last week’s sell-off and put it into perspective given other historical market corrections.
If you look at the largest Dow percentage drops of all time, you’ll notice that many of them occurred years ago.
- October 19, 1987: 22.61%
- October 28, 1929: 12.82%
- October 29, 1929: 11.73%
- November 6, 1929: 9.92%
- December 18, 1899: 8.72%
- August 12, 1932: 8.40%
- March 14, 1907: 8.29%
However, if you look at the largest Dow intraday point swings of all time, you’ll see that they’re all far more recent. Take a look. There have been two already this year. And we’ve seen four occur in 2018.
- February 27, 2020: negative 1,190.95
- February 02, 2018: negative 1,175.21
- December 26, 2018: 1,086.25
- February 08, 2018: negative 1,032.89
- February 25, 2020: negative 879.44
- August 24, 2015: negative 588.40
- February 06, 2018: 567.02
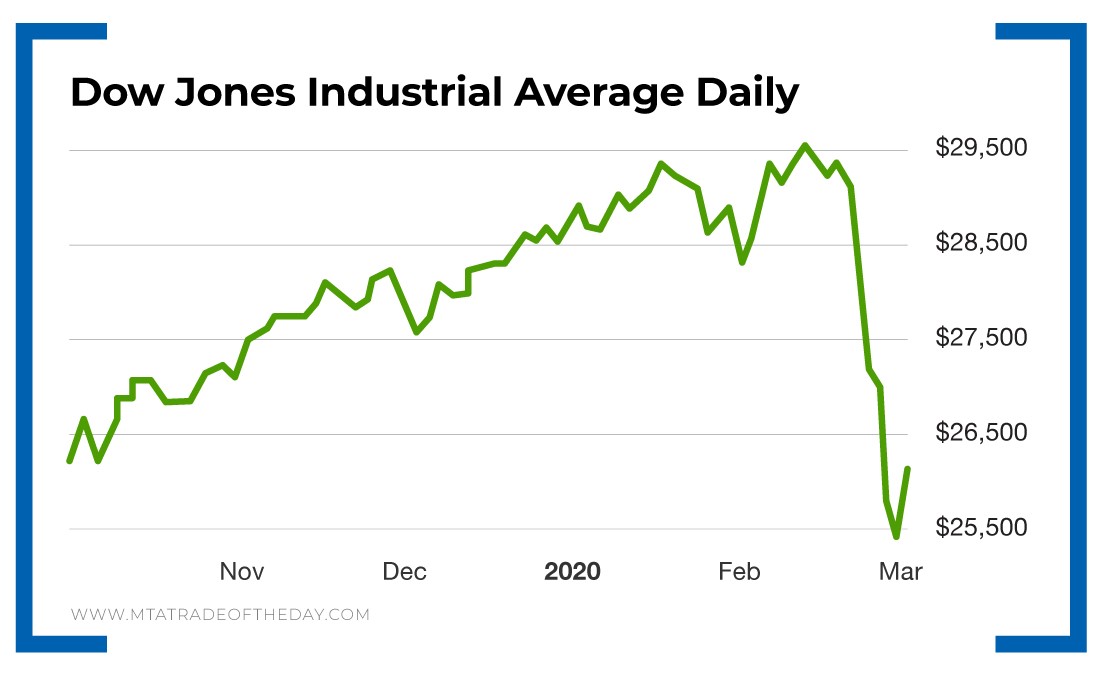
Looking at the Dow chart, here’s what last week looked like:
Action Plan: What’s the best trading strategy in the midst of this extreme market volatility?
This morning in The War Room, I used our “Overnight Trades” strategy to get a Nasdaq position that allows members to profit – whether the largest tech stocks in the world move up or down. As long as the move is large enough, we stand to profit.
In the midst of these massive intraday price swings, this makes the most sense right now.