This Oil Driller Just Became an AI Play
A Note From Publisher Stephen Prior: Iran is panic-buying gold at any price and driving miners to record highs. Karim Rahemtulla has spent 46 years waiting for a setup like this one.
On April 29 at 2 p.m. ET, he goes live to show you how to own the world’s best gold assets at 30% to 50% less than what others are paying right now.
Registration is free, but seats are limited.
Halliburton has been drilling oil wells since 1919.
Quite the old dog in the oil business.
But three weeks ago, it quietly acquired a Norwegian AI company that has made drilling wells 25% faster using automation and real-time machine learning.
The acquisition barely made the news… but the setup on the chart is getting harder to ignore.
The Business
Halliburton is the second-largest oilfield services company in the world. It does not produce oil.
It provides the technology, equipment, and services that help oil and gas companies find oil, drill it, and get it out of the ground.
It has 46,000 employees… and operations in every major producing region on earth.
When oil companies need to build wells, they call Halliburton.
The easy explanation for why the stock is up is the Iran war. WTI crude averaged $91 in March after the Strait of Hormuz closed.
Higher oil prices mean more drilling activity. More drilling means more work for Halliburton. That tailwind is real.
But the story that nobody is fully pricing in is the automation angle.
On April 2, Halliburton acquired Sekal, a Norwegian company that built a drilling automation platform called DrillTronics.
Sekal’s technology has been deployed in more than 1,300 wells globally. Combined with Halliburton’s own LOGIX AI system, it creates a fully automated drilling operation that manages well placement, hydraulics, and rig controls in real time.
The target is a 25% reduction in well delivery time. That is not a marginal improvement. That is a competitive advantage that oil companies will pay a premium for whether oil is at $70 or $90.
On the Q1 earnings call two days ago, the CEO said energy security is no longer a talking point. It demands action by every nation.
International revenue grew in Latin America and Europe. North America is in the early stages of recovery, with frac calendar gaps shrinking.
The company beat EPS estimates and signaled solid offshore growth through 2028.
And while that all sounds compelling, it’s the chart that gets me most excited.
The TPS Setup
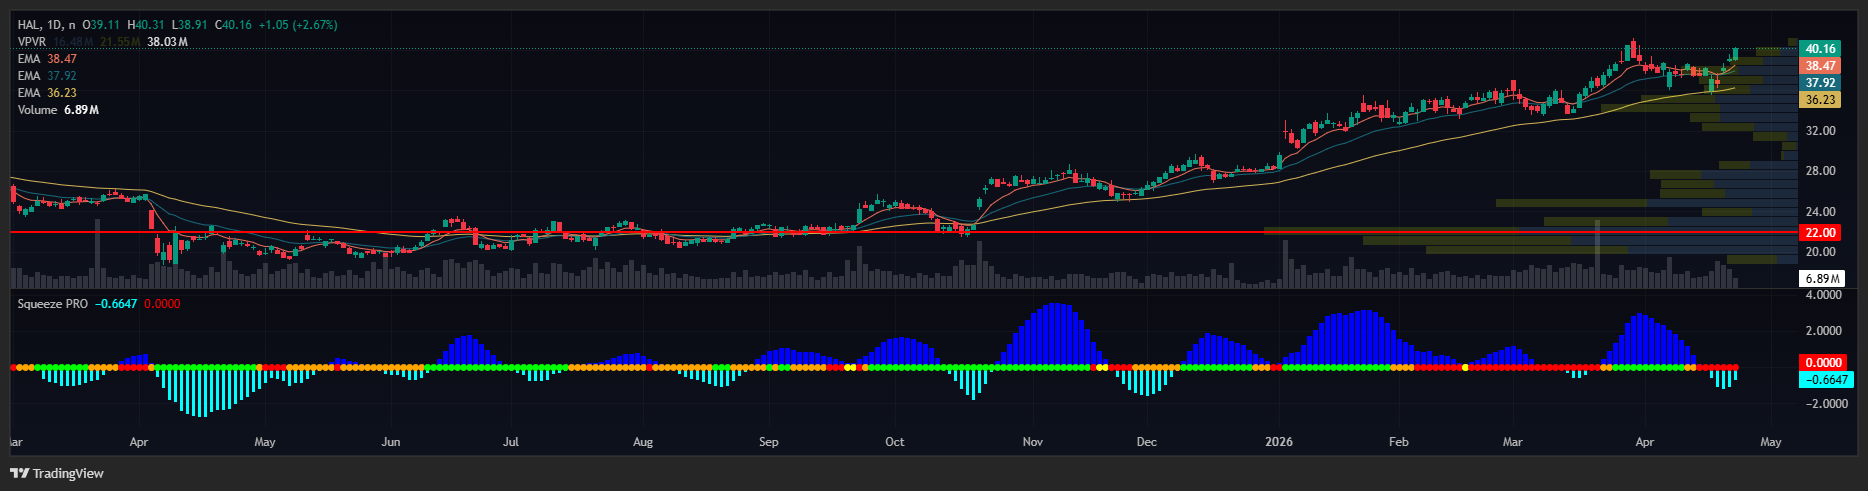
My system runs three checks before I look at any trade. Trend, Pattern, Squeeze. In that order.
The trend check starts with the moving averages. An exponential moving average, or EMA, weights recent prices more heavily than older data. On Halliburton’s daily chart price is sitting above the 8-day EMA. The 8-day is above the 20-day EMA.
The 20-day is well above the 200-day simple moving average, which is a straight average of the last 200 closing prices. That is a fully stacked structure with price on top.
The same stacked structure holds on the weekly chart. When both time frames confirm, the trend has institutional weight behind it.
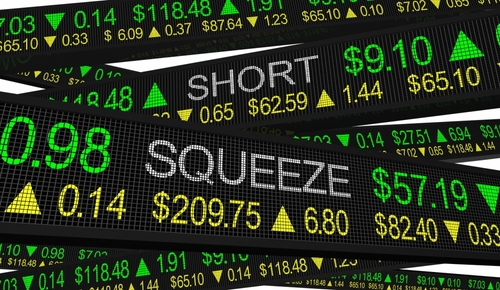
The pattern is a squeeze forming on the daily chart. A squeeze occurs when Bollinger Bands, which track how far price has strayed from its average, compress inside the Keltner Channels, which measure volatility based on average daily range.
When the bands contract inside the channels, momentum is coiling before a release. RSI is at 63.26, building without being stretched into overbought territory.
The trend is confirmed on daily and weekly charts. A squeeze is active on the daily.
The Bear Case
Q1 revenue was flat at $5.4 billion despite the earnings beat. Middle East activity remains uncertain, with higher costs expected near term due to supply chain disruption from the Iran conflict.
The stock is up 95% over the past year and 42% year to date. That is a lot of good news already priced in. If oil prices pull back meaningfully or the North America recovery stalls, this name will feel it.
Your Action Plan
Watch for the squeeze to fire. Watch for the price to hold above the 20-day on any pullback. When both show up together, that is when this becomes a compelling trade setup.
If you want to know how I’m moving, which trades I’m taking, you can find out more here.
More from Wake-up Watchlist


Healthcare Is No Longer Dead Money.
Jul 23, 2026

3 Stocks At All-Time Highs Just Got Downgraded
Jul 22, 2026