Finding Symmetry in These 2 Trades…

I said I wasn’t quite sure about the market’s direction last week.
But this week I have a better feel.
I’m leaning bullish after the consumer price index (CPI) report. And unless something changes, I think we can keep this rally going into next month’s CPI report and Federal Open Market Committee meeting.
So for today’s video, I’m using a concept I call “symmetry” for two trades.
I’ve talked about this strategy before, and I think finding symmetry is a great way to jump on stocks I’m bullish about.
Click the image below to see the two companies I’ve got an eye on.
![]()
YOUR ACTION PLAN
Here is the chart of the S&P 500 (SPX) showing the symmetry cluster zone around 3,900. Basically, if SPX comes into this level, I want to get long.

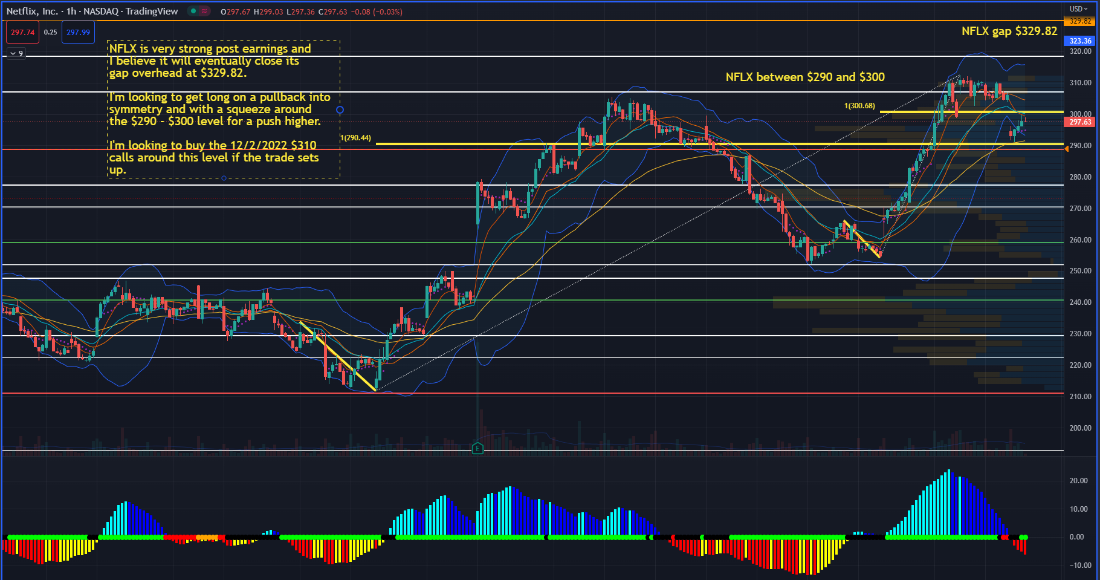
Below is the hourly chart for Netflix (NFLX). Note that this chart is not yet set up for a buy – I don’t yet have the red dots that indicate a squeeze. But I’m watching. And if we do get a squeeze, I’d like to get long in NFLX around the $290-$300 level.
I’ll look to pick up some of the NFLX December 2, 2022, $310 calls if this all comes together late this week or early next week.
Alright gang, that’s what I’ve got for this week. I hope it helps.
And if you’re looking to take your trading ability to the next level, I recommend checking out The War Room. It’s a community full of traders who come together to see trades in real time from trading veterans Bryan and Karim. They’ve had a 76% win rate in 2022, and right now they’re guaranteeing members will receive 252 winning trades in their first 12 months.
Click here to join The War Room.
P.S. If you have any questions, please email me at feedback@monumenttradersalliance.com, and I’ll get back to you in the next video update.
More from Trade of the Day

Gold Just Went on Sale – But the Reason Won’t Last
Jul 17, 2026
The Market Feels Different. Here’s What To Watch.
Jul 16, 2026
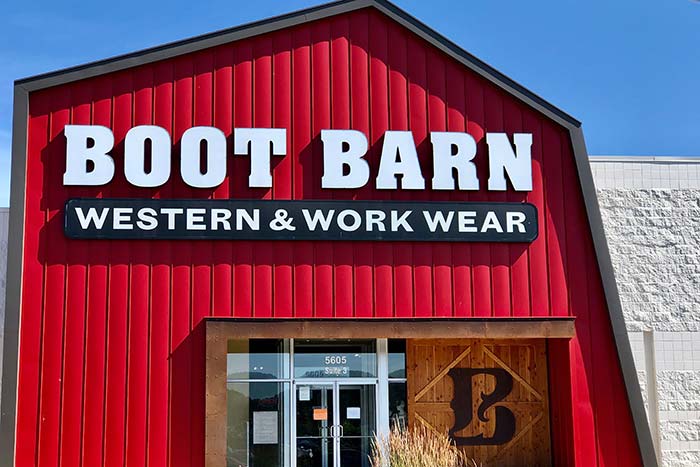
Saddle Up Sally! The Hottest Trend in Retail
Jul 15, 2026