The cleanest quantum chart I’ve found
You know, I’m scanning through charts this morning and I see RGTI… and I literally had to stop what I was doing.
That looks absolutely awesome. I mean, I like everything about this one – and I mean everything.
Look, I’m still getting my trading legs back under me after Hawaii. The jet lag has me feeling all awkward and I’m being super careful with sizing, right?
But when you see this many confluences line up on one chart like this… I think you’ve got to pay serious attention.
This is exactly what I’ve been waiting for.
So Here’s What Got Me Excited
RGTI – Rigetti Computing – has this daily squeeze that looks like it wants to fire long. For those who don’t know, a squeeze happens when the Bollinger Bands get really tight around the price action – it’s like a coiled spring ready to pop in either direction.
But here’s what really made me stop: it’s also got a weekly squeeze setting up at the same time. You know, when you get daily and weekly squeezes aligning like that… I don’t know, that’s when the magic happens. It’s like having multiple timeframes all screaming that something big is about to move.
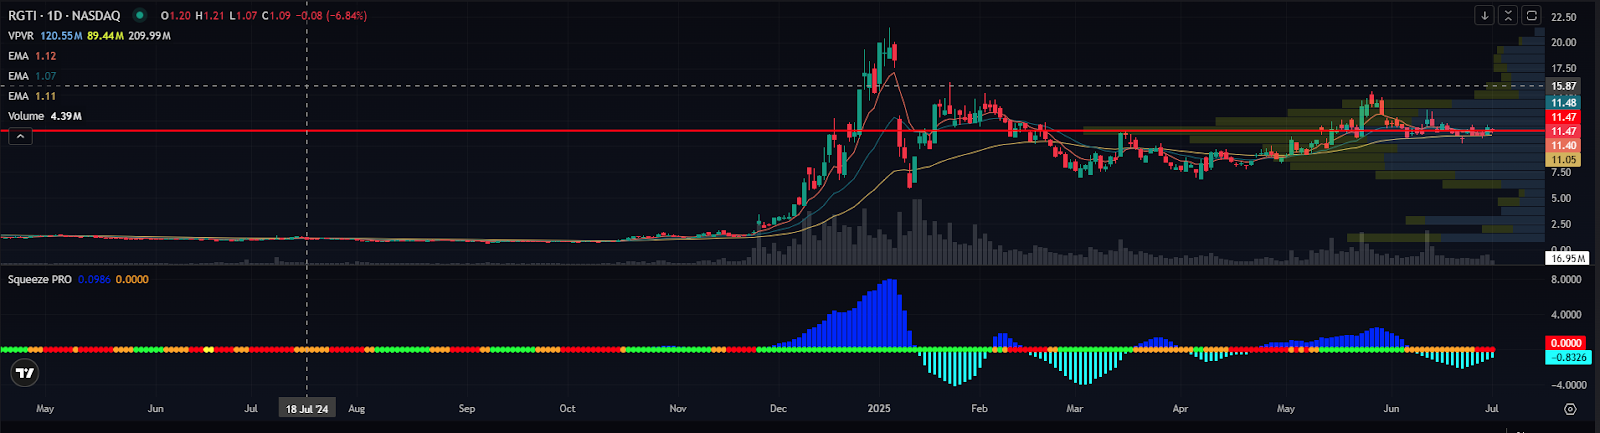
And the weekly EMAs are stacked bullishly too – the 8, 21, and 50-week exponential moving averages are all lined up perfectly. When you see that kind of alignment on the weekly timeframe, it tells you the bigger picture trend is rock solid.
Then I check the short float – 22.5%.
That’s really good. Short float is basically how much of the available shares are being borrowed and sold short.
When it’s this high and the stock starts moving up, those short sellers get squeezed and have to buy back their shares. That buying pressure can absolutely rocket a stock higher.
You know how these quantum names can move when they get momentum, and with that kind of short interest? If this thing starts running, it could get really interesting really fast.
Your Action Plan
When you get this many confluences – daily squeeze, weekly squeeze, stacked weekly EMAs, high short float, good volume, sitting at technical support – that’s when setups tend to work, right?
There’s a gap to fill up around $15.
Will I hold it that long? I don’t know, we’ll see. But I could easily see myself getting into this for a swing trade at some point this week if the setup continues to develop.
If you’re looking at RGTI, I think you want to see it hold above this point of control area and ideally get above that $10.87 to $11 zone. That would really open the door for higher prices.
You know, that’s the thing about swing trading. You’re not trying to catch every move. You’re waiting for those setups where multiple factors align, where the risk-reward makes sense.
RGTI has all of that right now. We’ll see if it works out.
Speaking of explosive setups…
While I’m watching RGTI develop as a swing trade, I’m also always hunting for a completely different type of opportunity – Opening Bell Aftershocks. These are explosive moves that happen in the first few minutes after the market opens, when most traders are still drinking their coffee.
I recently turned a simple trade on APP into a 334% gain — in just 11 minutes after the market opened.
The next Opening Bell Aftershock could happen as soon as tomorrow at 9:30 AM… so don’t wait.
Want to learn exactly how I spot these high-probability setups when they’re quietly building? My complete system shows you the exact process I use to identify these overlooked patterns while everyone else chases the crowd.
More from Wake-up Watchlist

My Scanner Just Flagged 2 Sector Rotation Plays
Jul 14, 2026

The Peace Deal Just Blew Up. Energy Is Back.
Jul 13, 2026