This Chart Made Me Shake
This Chart Gave Me Goosebumps.
Seriously.
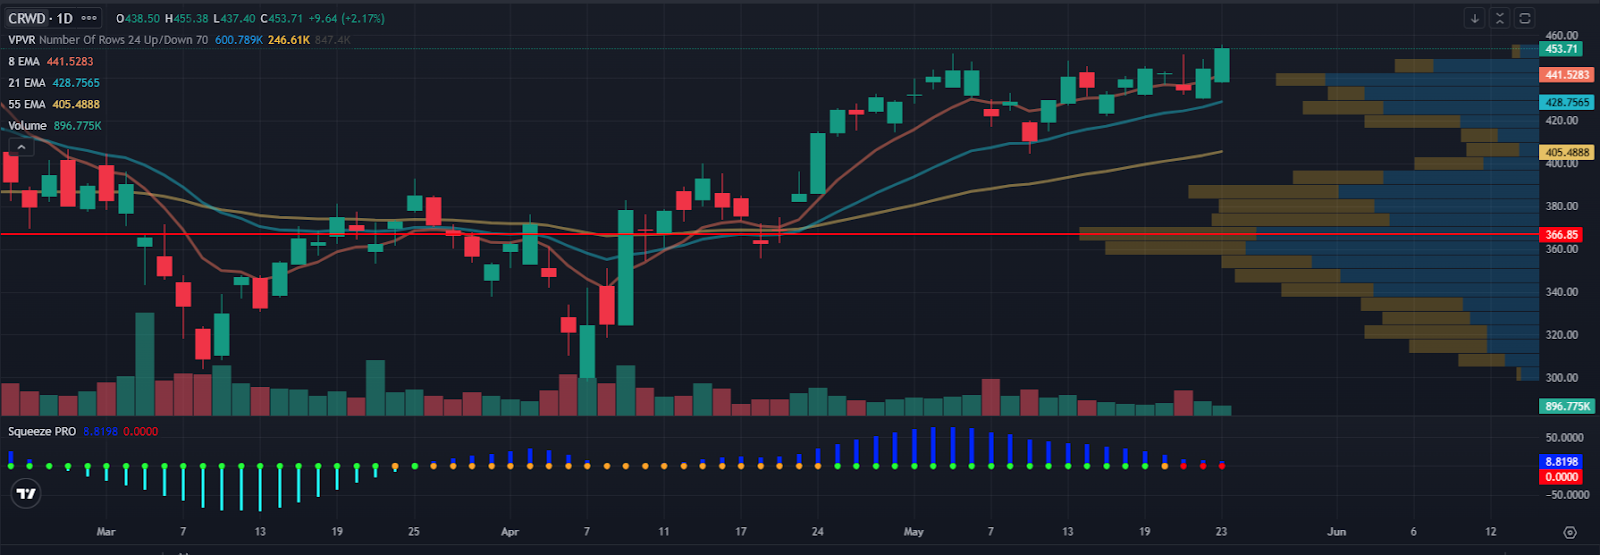
CRWD just hit 52-week highs while the major indices have done absolutely nothing all year.
But that’s not what got my attention.
Look at what’s setting up on multiple timeframes right now, and you’ll see why this thing could absolutely explode in the next few weeks.
The Chart is Speaking to Me
While the SPY and QQQ have been basically going sideways all year – just chopping around doing nothing – CRWD is up 30% year-to-date. That’s what we call relative strength, and when you see that kind of outperformance, you gotta pay attention.
But here’s where it gets fun…
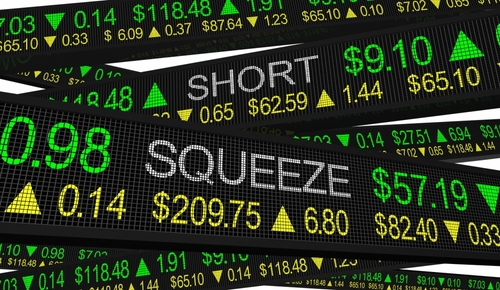
Multiple Squeezes Are Lining Up
We’ve got a daily squeeze setting up here. And if you don’t know why that’s bullish, let me break it down real quick – when you get a squeeze on the daily timeframe, that’s your market telling you a big move is coming. The volatility gets compressed like a spring, and eventually something’s gotta give.
Now here’s the kicker – we’re not just talking about the daily. The 130-minute chart has a squeeze. The 70-minute has a squeeze. When you get multiple timeframes all setting up at the same time like this, man… that’s when things can get absolutely nuts.
It’s like having three different alarm clocks all going off at once. You know something big is about to happen.
Stacked EMAs = Trend is Your Friend
The EMAs on this thing are stacked perfectly on both daily and weekly. For those who don’t know what that means – when your shorter-term moving averages are sitting above your longer-term ones, in perfect order, that’s basically the market saying “hey, the trend is up and it’s strong.”
Every little dip gets bought. Every breakout gets follow-through. It’s like trading with the wind at your back instead of fighting against it.
What Does This Company Even Do?
Oh right, probably should mention that. CrowdStrike does cybersecurity – cloud-based endpoint protection for big companies. Basically, they’re the digital bodyguards keeping hackers out of corporate networks. And business has been pretty darn good.
Why This Could Absolutely Rip
Here’s what’s got me fired up about this setup. You’ve got:
- Daily squeeze ready to fire
- Multiple smaller timeframes aligned
- Sitting at 52-week highs (bullish as hell)
- Massive relative strength vs the indices
- Perfect EMA stack on daily and weekly
When you get all this stuff lining up at once, man, this is the kind of setup that can absolutely rip. I mean, we’re talking about the type of move that makes your whole week.
Your Action Plan
I’m not in yet, but I will be interested if it can pull back a little.
I’ll probably start with a small position.
These setups can rip when they work, but they can also fail spectacularly, so I’m not going all-in right away.
The chart is telling us a story here, and I think it’s saying this thing wants to go higher. If the setup confirms, I’ll be ready to jump on it.
But speaking of setups that rip… you know what’s been working even better lately? Something I call “Opening Bell Aftershocks.”
I recently turned a simple trade on APP into a 334% gain — in just 11 minutes after the market opened.
The next Opening Bell Aftershock could happen as soon as tomorrow at 9:30 AM… so don’t wait.
More from Wake-up Watchlist


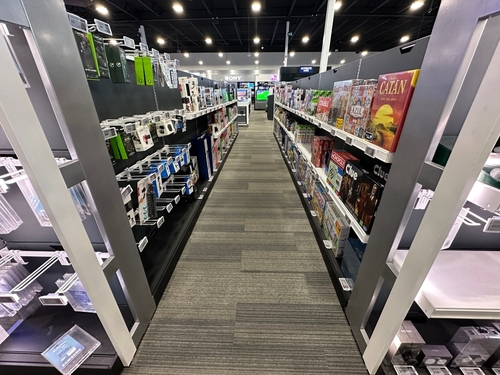
The Market Is Shaky. This Retailer Is Coiling.
Jul 8, 2026
The Mag 7 got boring, so I went hunting
Jul 7, 2026