This Grocery Stock Is Up 16% While the Market Sells Off.
Publisher’s Note: Elon’s rolling out a new space initiative, transforming Tesla into an AI chip rival to Nvidia, and launching what he’s calling “the biggest product of all time.”
All three happen before the end of April.
Dr. Mark Skousen has identified three stocks positioned to explode off these launches — and he’s breaking down all three live on Wednesday, April 8 at 2 PM ET.
I got a sneak peek at his research. The supply chain plays are real. And the timing looks dead on.
If you don’t position before these launches hit, you’re watching from the sidelines.
— Stephen Prior, Publisher
Kroger sold $34.7 billion worth of groceries last quarter.
That is what this company does. People eat in every market. Wars, recessions, and rate hikes. The shopping list does not change. That consistency is exactly why the chart looks the way it does right now.
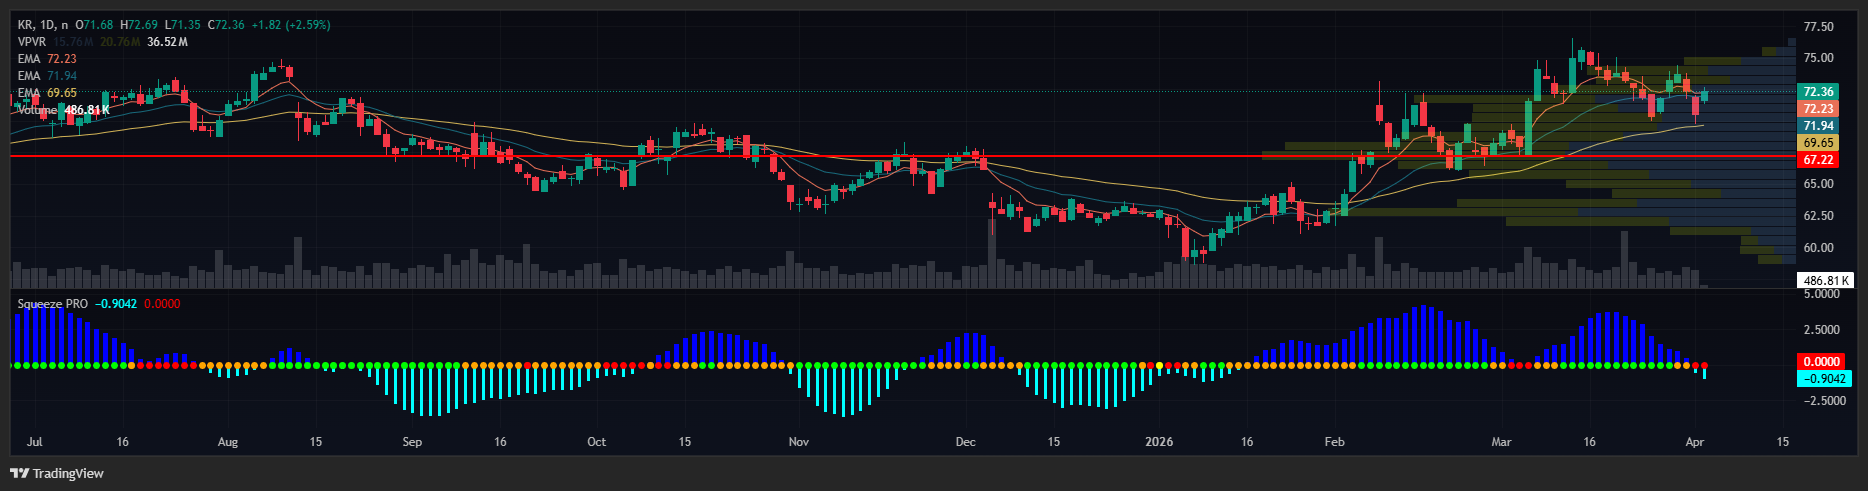
KR is up over 16% year to date, while the S&P has been selling off hard. That kind of outperformance in a rough tape tells you real money is moving into this name with a purpose.
The earnings confirmed it.
Q4 results released March 5 were a beat across the board. EPS came in at $1.35, up 50% from the same quarter last year. Same-store sales excluding fuel were up 2.4%. eCommerce grew 20%.
Cash from operations nearly doubled. The company authorized another $2 billion in share buybacks. New CEO Greg Foran reaffirmed full-year guidance.
Strong earnings on a stock already trending higher. That is the combination TPS is built to find.
TPS stands for Trend, Pattern, Squeeze.
All three have to line up before I pay attention to a setup. Here is where KR stands on each one.
Trend: An EMA, or exponential moving average, tracks a stock’s average price. It gives greater weight to recent actions than to older data. When the short EMA sits above the long one, that is bullish.
When both sit above the 200-period moving average, that is called stacked.
It means buyers have been consistently stepping in at higher prices. On KR, the 8-day EMA is above the 20-day EMA. Both are well above the 200 SMA. Stacked on the daily. Stacked on the weekly.
Pattern: After running from $62 in January to a high around $76 in February, KR pulled back and coiled just above its uptrend line. A tight consolidation after a strong trend move is exactly what TPS looks for. Today, that coil is starting to release.
Squeeze: A squeeze forms when Bollinger Bands contract inside Keltner Channels. Bollinger Bands measure the width of the recent price range. Keltner Channels measure average volatility. When both compress together, volatility has collapsed, and a move is building. The daily squeeze on KR has fired. Today is the first signal.
I turned $37,000 into $2.7 million in four years using this system. The setups that produced that result looked a lot like this one. Business is holding up. Trend intact. Pattern coiling. Squeeze fired.
Your Action Plan
KR is trading at $72.56. The 20-day SMA at $73 is the first level to clear. A clean close above it on volume confirms the move is real. The prior high near $76 is the next target. The 200-day SMA near $68 is the stop reference.
If KR closes below that on volume, the setup changes.
More from Wake-up Watchlist


The Market Is Shaky. This Retailer Is Coiling.
Jul 8, 2026
The Mag 7 got boring, so I went hunting
Jul 7, 2026